Trading Systems
Built for MetaTrader 4 & 5
Harmonic Patterns Trading System
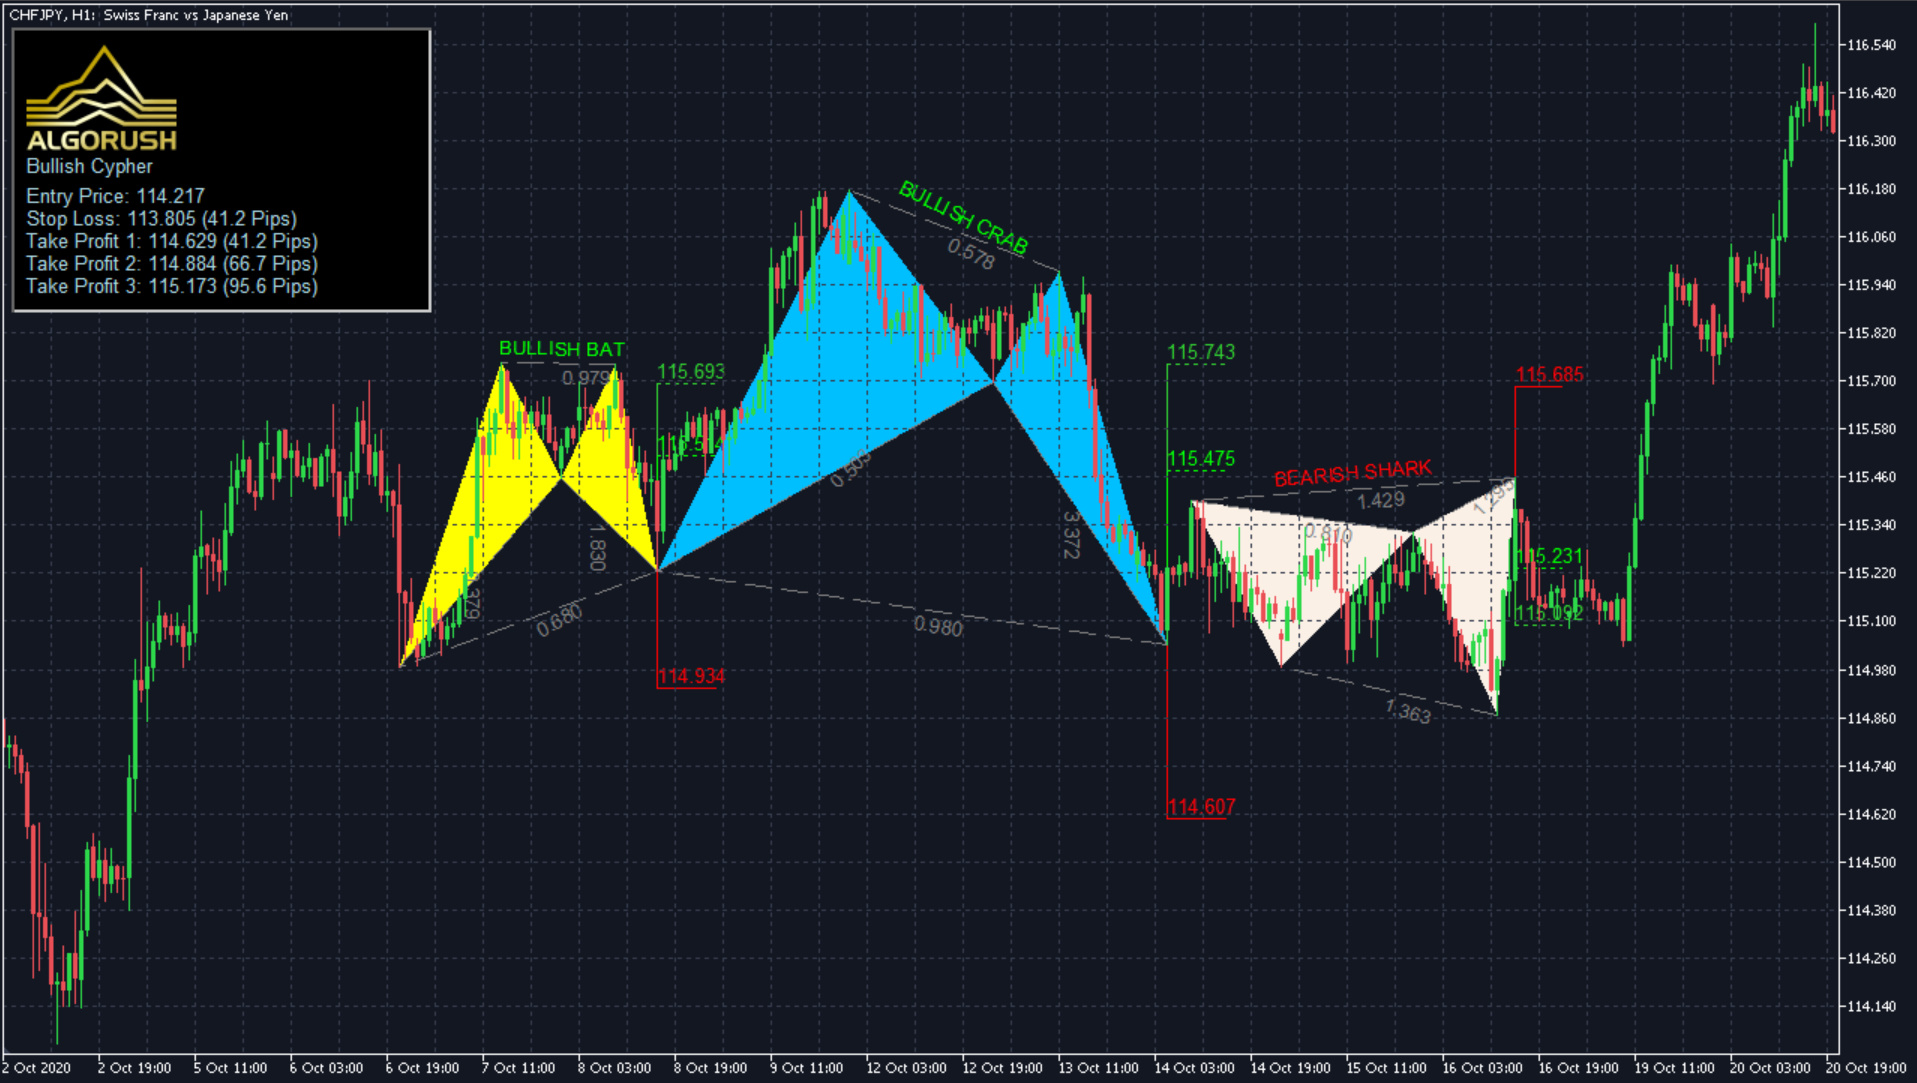
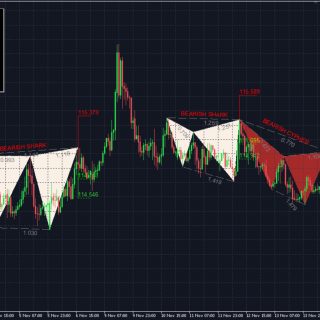
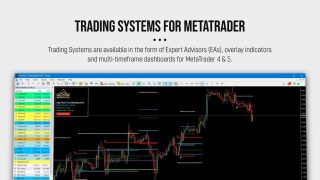
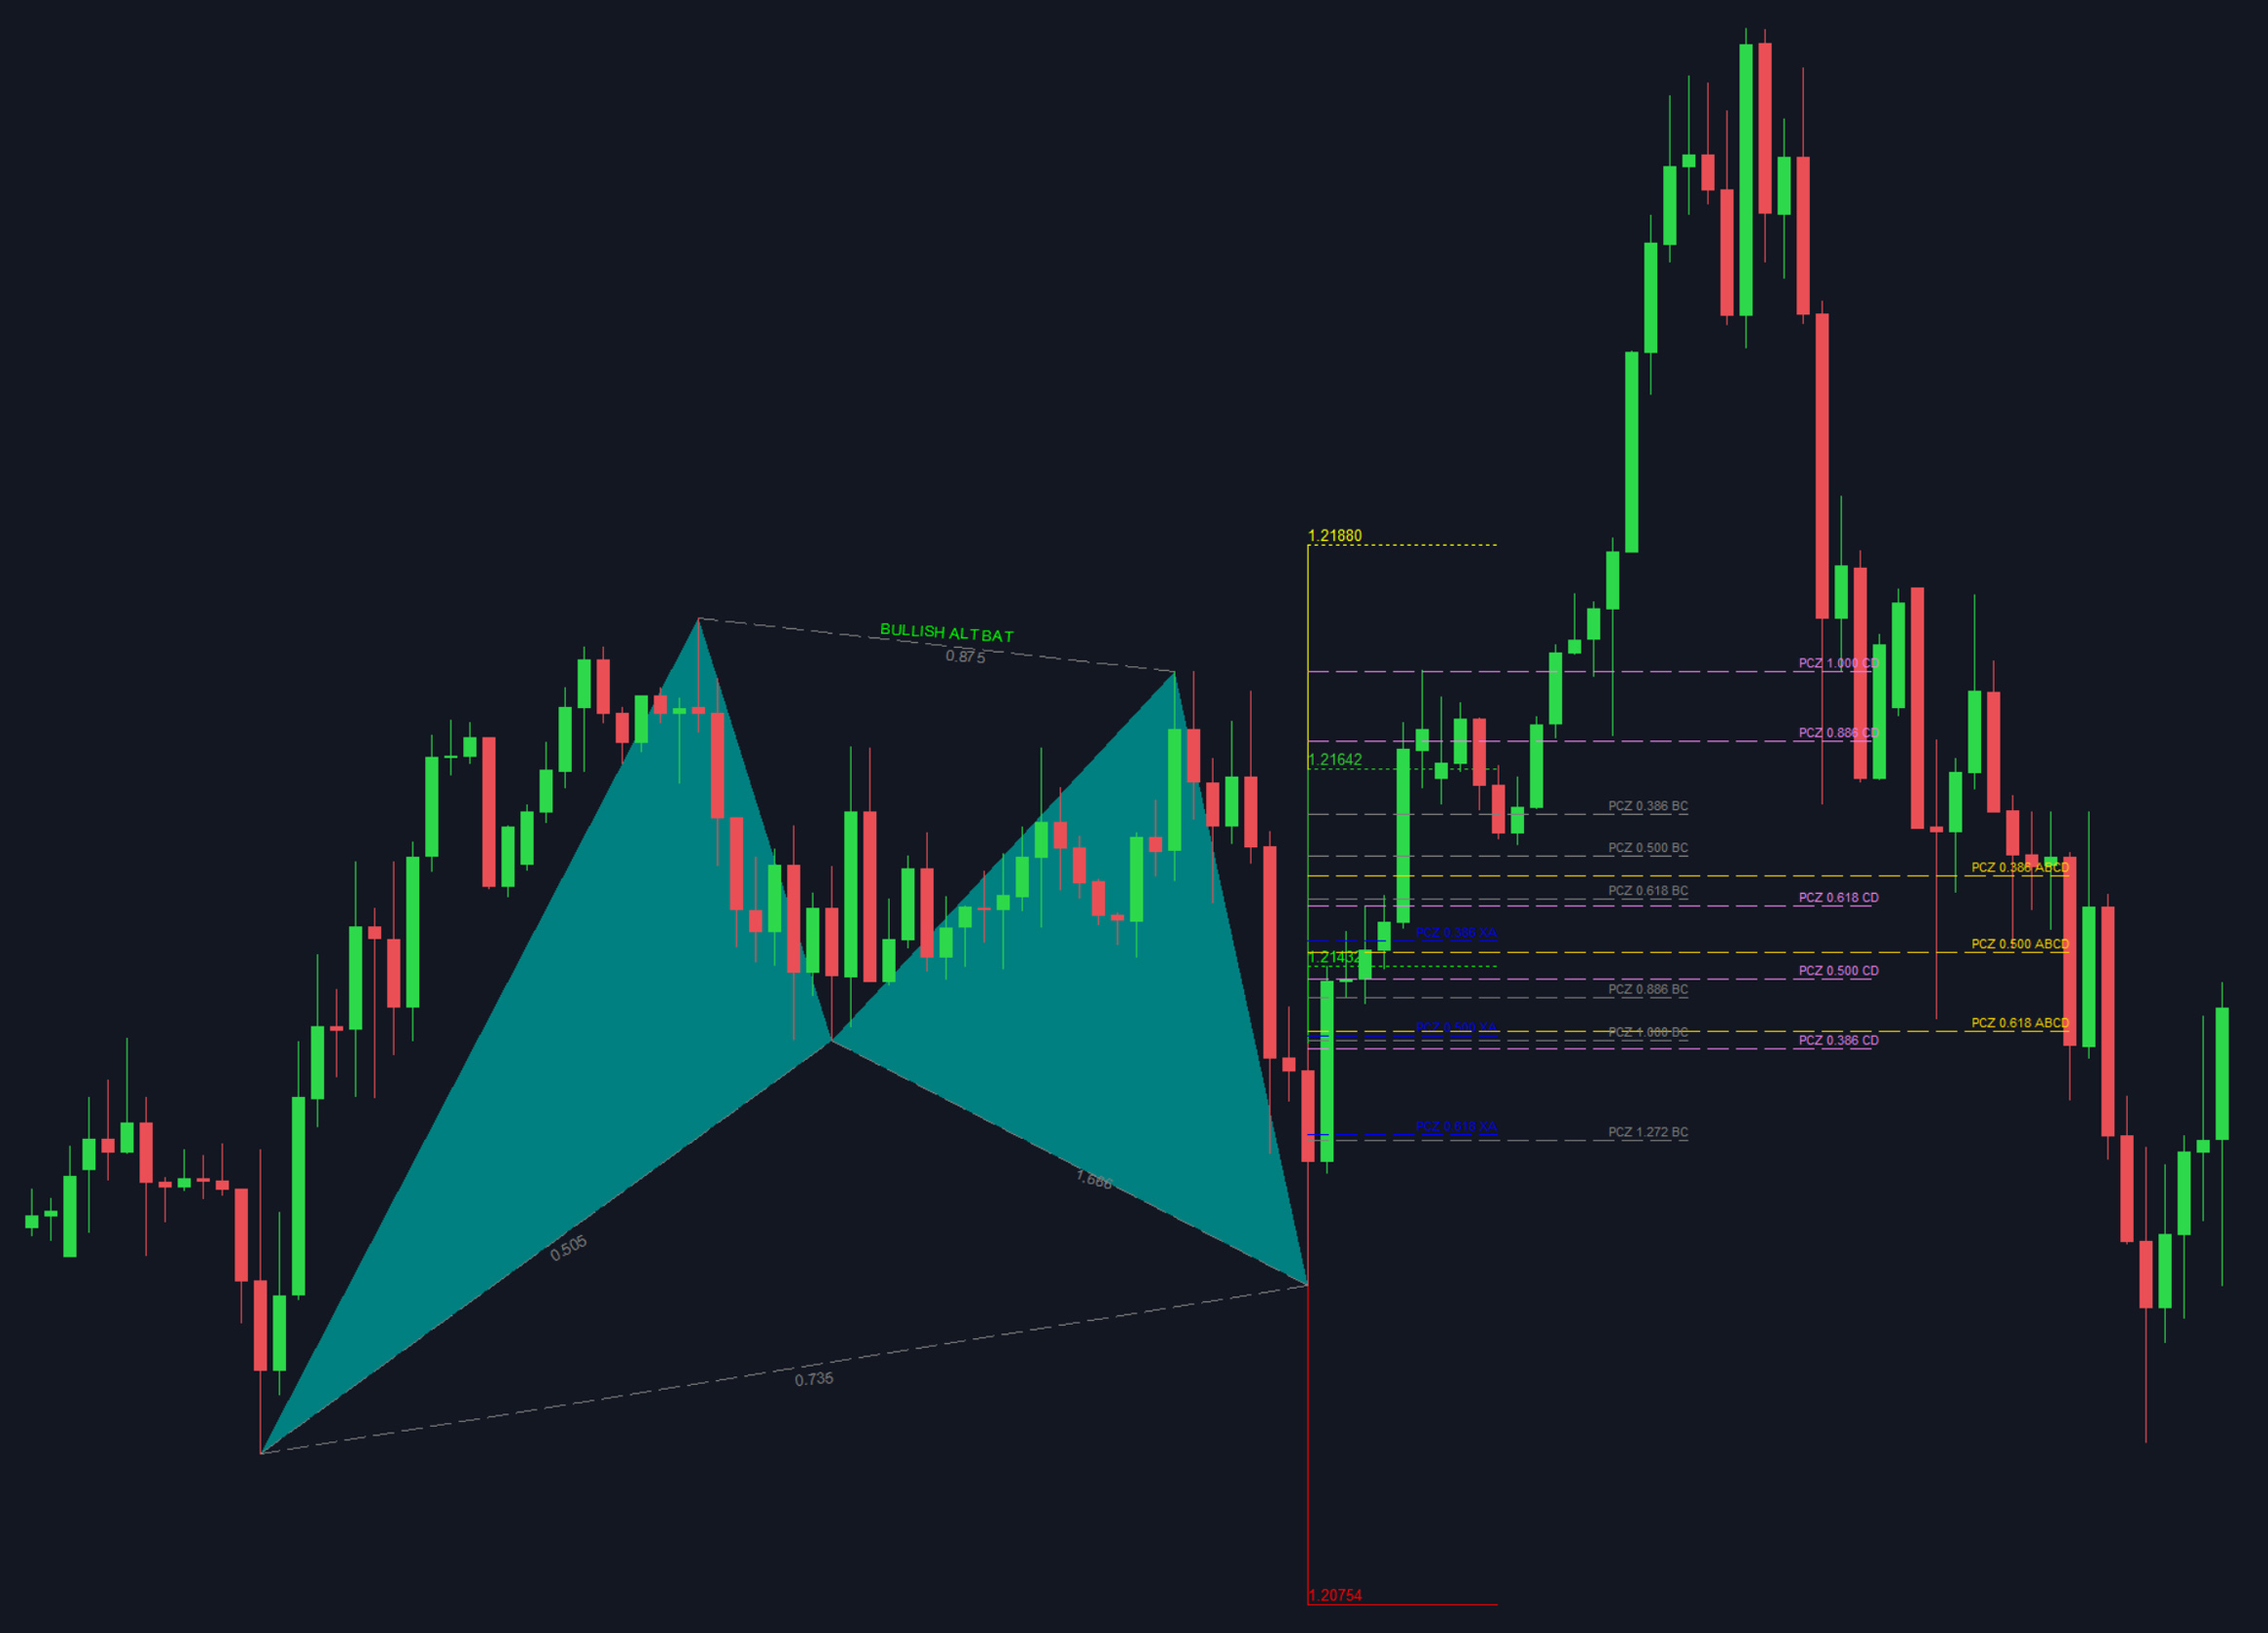
The Harmonic Patterns Trading System scans for thirteen types of harmonic patterns with a optimizable parameters for calculating turning points, take-profits, stoplosses and trailing values. The system uses price data to confirm turning points for Fibonacci extensions and retracements.
Unlike other common price trading methods, the system attempts to predict future movements by incorporating either the Potential Reversal Zone (PRZ) or the Price Continuation Zone (PCZ) methodology which are customizable with user-defined inputs.
Works seamlessly on any asset class including Forex, stocks, commodities, futures and crypto. Trading setups which use harmonic patterns on top of existing strategies help providers traders with additional support for locating entries and target levels.
What’s included in The Harmonic Patterns Trading System:
- Harmonic Patterns Indicator for MetaTrader 4 & 5
- Harmonic Patterns Expert Advisor (EA) for MetaTrader 4 & 5
- Harmonic Patterns Multi-Pair/Timeframe Dashboard for MetaTrader 5
- Indicator, EA and dashboard user guides/documentation on our wiki
- Order Snipe MT5 Bridge Addon: Interactive Brokers & Crypto Exchanges
Indicator Dashboard Expert Advisor (EA)
Tradingview, NinjaTrader, eSignal & MultiCharts versions coming soon.
The Harmonic Patterns System is included in our subscription package which comes equipped with all trading systems and billed either monthly, quarterly or annually.
SubscribeProduct Description
Harmonic Patterns System Overview
Harmonic Patterns System Overview
Harmonic patterns primarily consist of geometric pattern structures using Fibonacci sequences. The geometric price pattern structures are defined by both retracement and projection Fibonacci levels that are plotted from reversal swings and legs. Harmonic pattern structures provide unique opportunities for traders, such as potential price movements and key turning or trend reversal points. This factor adds an edge for traders as harmonic patterns attempt to provide highly trustworthy information on price entries, stops and targets information.
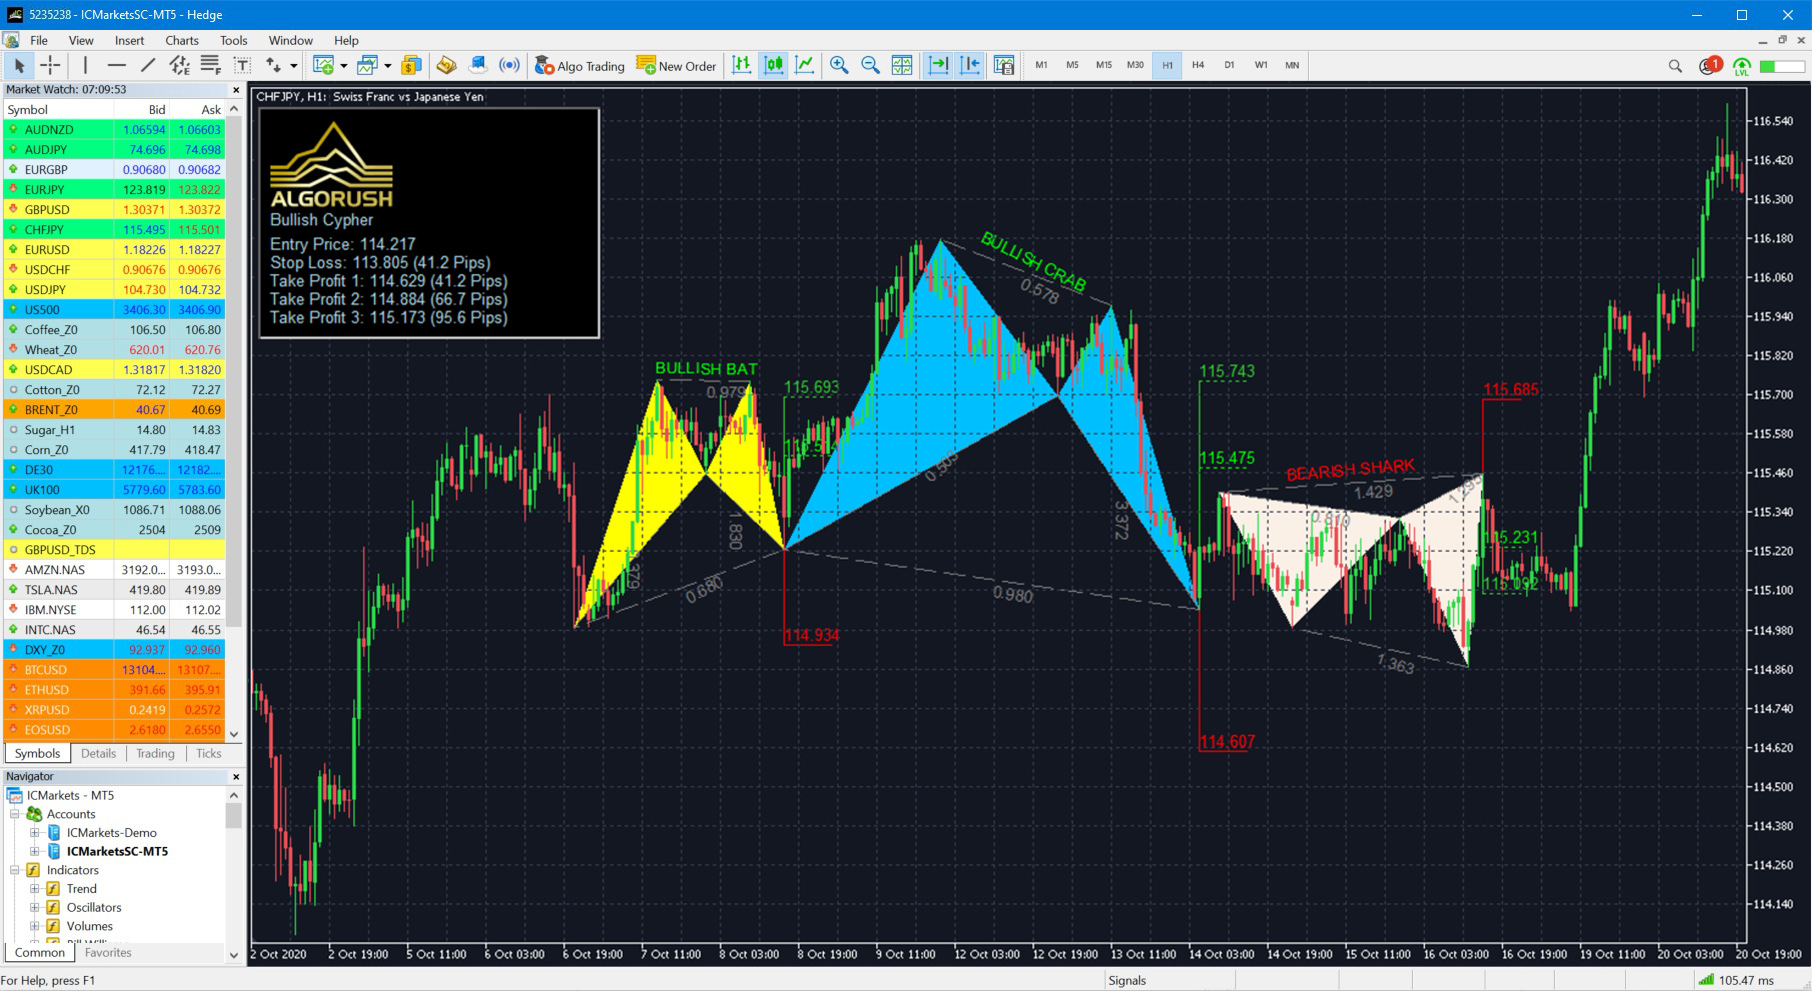
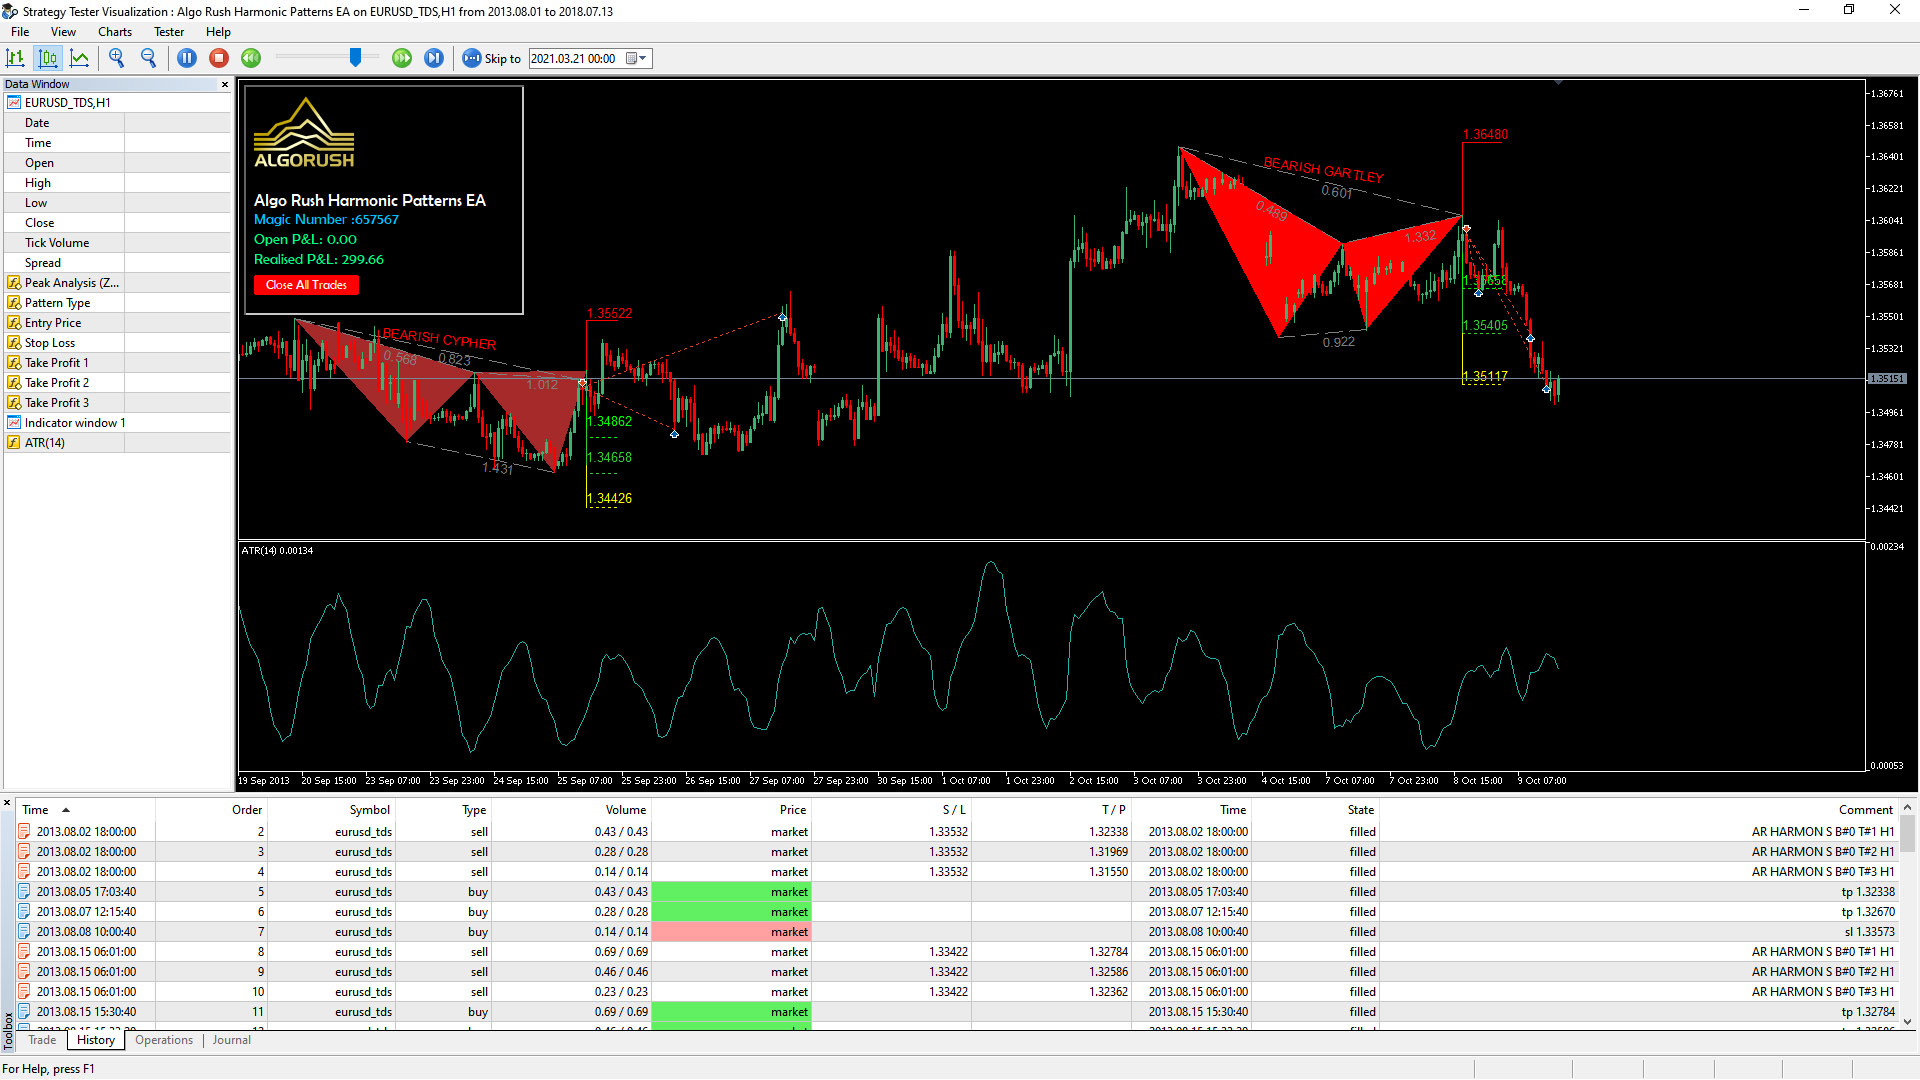
Built specifically for harmonic traders and harmonic pattern enthusiasts who are familiar with both Pattern Completion Zone (PCZ) and Potential Reversal Zone (PRZ) reversal methodologies. The system is currently available for both MetaTrader 4 (MT4) and MetaTrader 5 (MT5). The harmonic pattern indicator, dashboard and Expert Advisor (EA) are non-lagging and non-repainting with options to optimize projected harmonic trading setups thus enabling users to receive the same results for the same parameters used on different system components.
Reversal methodologies used in the system:
-
-
- Potential Reversal Zone (PRZ)
- Pattern Completion Zone (PCZ)
- also known as the Potential Completion Zone (PCZ)
-
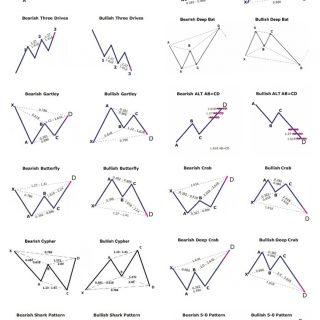
Harmonic patterns included in the system:
-
-
- 5-0 Pattern
- AB=CD Pattern
- Alternate AB=CD Pattern
- Gartley Pattern
- Bat Pattern
- Alternate Bat Pattern
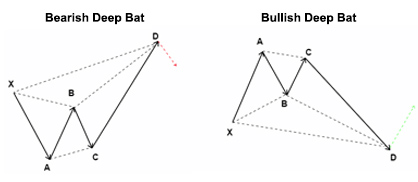
- Deep Bat Pattern
- Crab Pattern
- Deep Crab Pattern
- Butterfly Pattern
- Shark Pattern
- Cypher Pattern
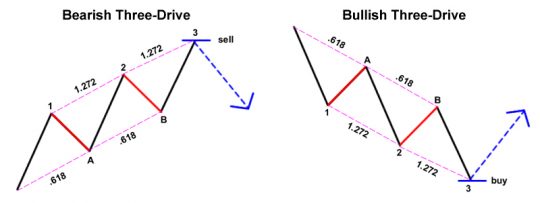
- Three Drive Pattern
-
Supported platforms for each system component:
–
Harmonic Pattern Indicator
-
-
- Harmonic Pattern Indicator for MetaTrader 4 (MT4)
- Harmonic Pattern Indicator for MetaTrader 5 (MT5)
-
Harmonic Pattern Expert Advisor (EA)
-
-
- Harmonic Pattern Expert Advisor (EA) for MetaTrader 4 (MT4)
- Harmonic Pattern Expert Advisor (EA) for MetaTrader 5 (MT5)
- Recommended for machine learning when performing fast and slow genetic optimizations
-
Harmonic Pattern Dashboard
-
-
- Harmonic Pattern Dashboard for MetaTrader 5 (MT5)
-
Coming soon to the following charting & trading platforms:
-
-
- Tradingview
- NinjaTrader
- eSignal
- MultiCharts
-
Harmonic pattern lessons are also available:
-
-
- Harmonic Trading 101
- What are Harmonic Patterns?
- How to Trade Harmonic Patterns
- XABCD & Other Harmonic Variations
- Harmonic vs. Geometric Patterns
- Reversal & Turning Point Methods
- Potential Reversal Zone (PRZ)
- Pattern Completion Zone (PCZ)
- Harmonic Trading Patterns
- All 13 harmonic patterns from the Harmonic Pattern System
- Harmonic Trading 101
-
References
https://algorush.com/wiki/harmonic-patterns-system-overview
https://algorush.com/trading-systems-for-metatrader/harmonic-patterns-overview/
Start Harmonic Trading
Learn Harmonic Patterns
Recent Trading Guides
-
December 18, 2020
Harmonic Patterns Explained For Beginners
-
November 17, 2020
Trading Breakouts within Price Action & Multiple Indicators
-
October 28, 2020
Importing High Quality Tick Data on MetaTrader 4 & 5
Looking for User Guides?
Instructions for Algo Rush Expert Advisors, Indicators & Dashboards.
Trading Systems
-
From: $19.99 / month with 1 week free trial
Harmonic Pattern Indicator
Harmonic Patterns Indicator
The Harmonic Patterns Indicator is available on MetaTrader 4 (MT4) and MetaTrader 5 (MT5). Trader can view over twelve harmonic patterns while using either the Potential Reversal Zone (PRZ) or the Pattern Completion Zone (PCZ) to determine key reversal points along with their targets within past and upcoming projections. The harmonic pattern indicator can also be loaded on Order Snipe which allows users to have access to stocks and futures charts on Interactive Brokers (IB) and several crypto exchanges including Binance, BitMEX, FTX, KuCoin and more.

Harmonic Patterns Indicator Settings on MetaTrader 4 & 5
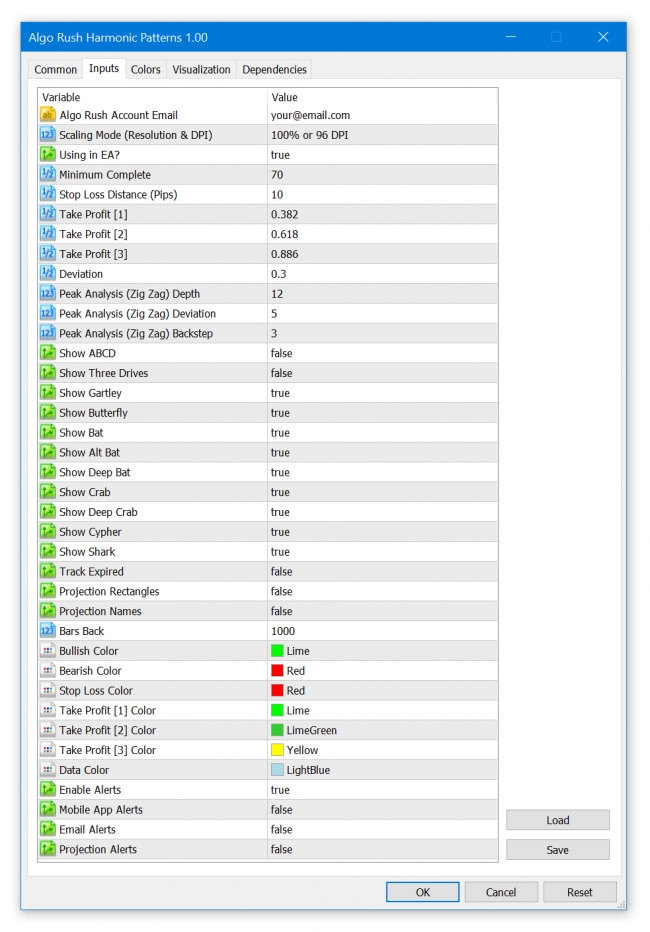
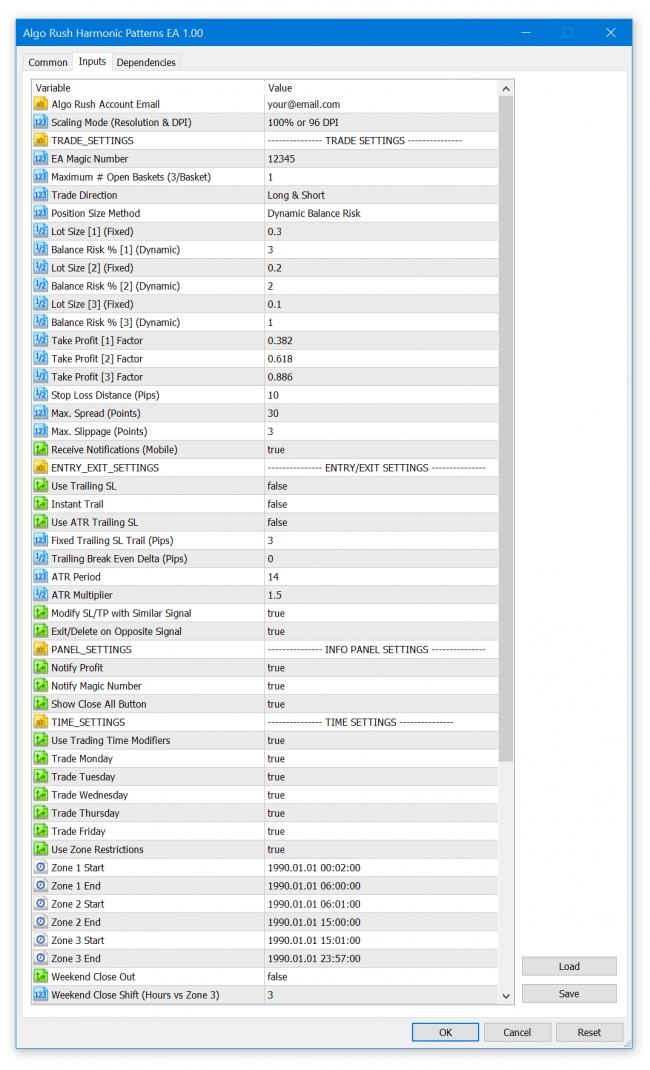
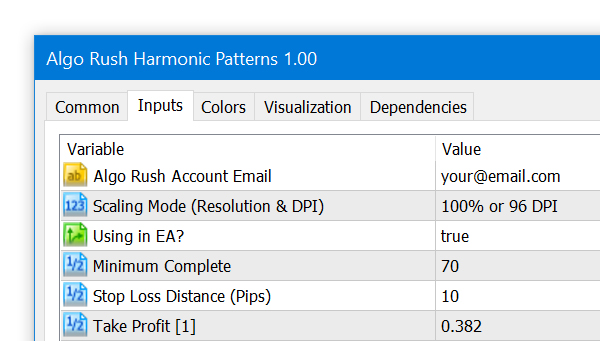
Algo Rush Account Email
The email address that the active Algo Rush subscription is under.
- Note: The indicators and Expert Advisors will not initiate without an email address linked to an active subscription.
Scaling Mode (Resolution & DPI)
Users with either resolutions above 1080p (1920×1080) or DPIs above 96 will need to adjust the scaling mode settings to an option above the default 100% value. Adjusting this will resolve any issues with displaying objects such as text, buttons and windows within active charts.
- 100% or 96 DPI (default)
- 125% or 120 DPI
- 150% or 144 DPI
- 175% or 168 DPI
- 200% or 192 DPI
- 225% or 216 DPI
- 250% or 240 DPI
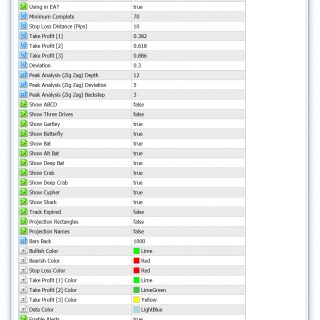
Using in EA?
When you are using the indicator inside an EA you should set it true to prevent drawing visual objects so the EA will save data of detected harmonic pattern in a separate text file for further use.
- Default: false
Min. Complete
A form of deviation but only for projection patterns. When you set ‘Deviation’ paramater too strict the scanner will check the MinComplete parameter. How much you decrease will form more projections as a result.
- Default: 70
SL Distance (Pips)
You can increase SL level by increasing this value, it’s simply just additional pips to stop loss fib level.
- Default: 10
TP [1]
The first multiplier within the fib range for determining second take profit level.
- Default: 0.382
TP [2]
The second multiplier within the fib range for determining second take profit level.
- Default: 0.618
TP [3]
The third multiplier within the fib range for determining second take profit level.
- Default: 0.886
Deviation
A number to determine the percentage of how much away a pattern can deviate from its original harmonic pattern structure. How much you increase it will increase the number of detected patterns that have a higher deviation from the original patterns’ ratio. Keeping it low will give you less patterns with the trade-off for getting cleaner and more appropriate pattern matches.
- Default: 0.3
Peak Analysis Depth
- Default: 12
A minimum amount of periods needed for the trend to be able to change/switch. With a depth of 1, the trend can change every period (bar) however with a depth of 2 the trend can change only starting from 2 periods (bars). The value you use ultimately depends on what the length of your chosen period is. Below is an example:
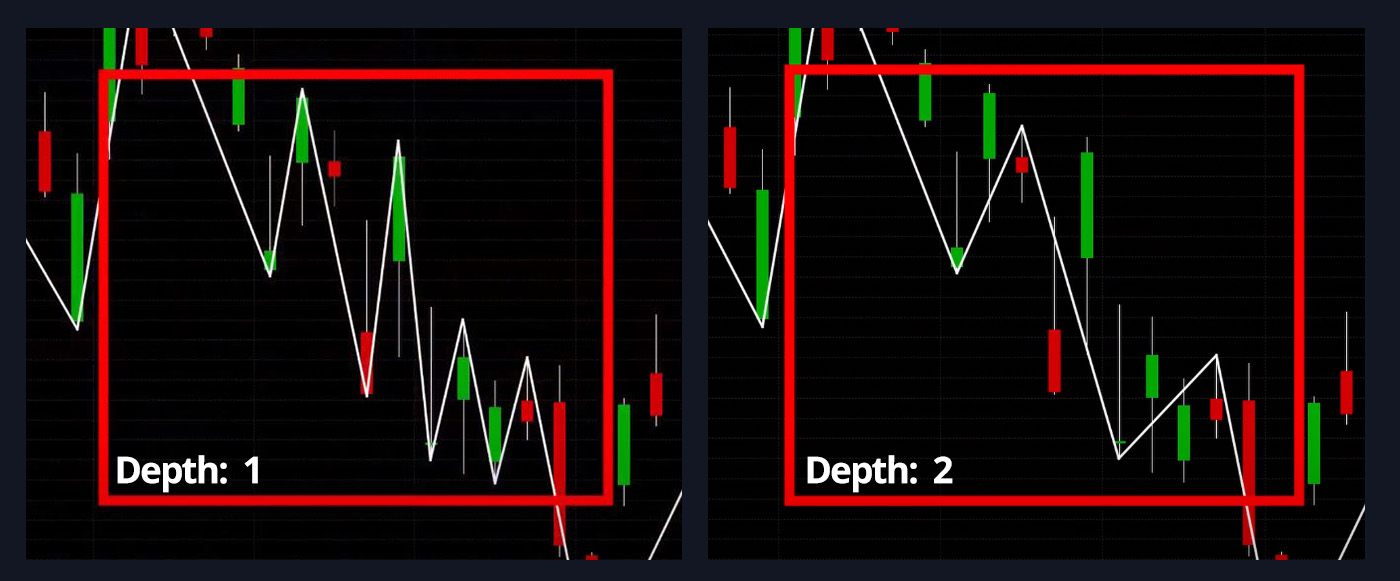
Depth – the parameter allows to specify the minimum number of periods, needed to draw one segment of the indicator’s line. The possible values are from 1 through 10,000. The default value is 12. The smaller the number is, the shorter the segments are and the line changes its direction more often. The greater the number is, the longer the segments are, and the line changes its direction less frequently. A trader chooses the Depth parameter’s value in accordance with what chart figures need to be identified. For identifying Harmonic Patterns and Elliott Waves, for example, the commonly used value is 12 (default).

Above you can see examples of ZIGZAG indicators with different Depth parameter’s values (2, 12, 100) drawn in additional areas.
Peak Analysis Deviation
- Default: 5
The minimum percentage that price has to change in order for the trend to change directions. The default value is 5. A trader chooses the Backstep parameter’s value in accordance with what chart figures need to be identified.
- Will look for the previous low, then look for the uptrend.
- For shorts it will look for the previous high, then look for the downtrend.
In the example below, we included a variety of different zigzag lines with different deviation values. These differences in deviation values determine how strong a rebound has to be (in terms of % change) for a pivot to be considered. This works in conjunction with the “Depth” option since that option defines the minimum amount of periods (bars) required since the last rebound if the deviation rule becomes valid at any time.
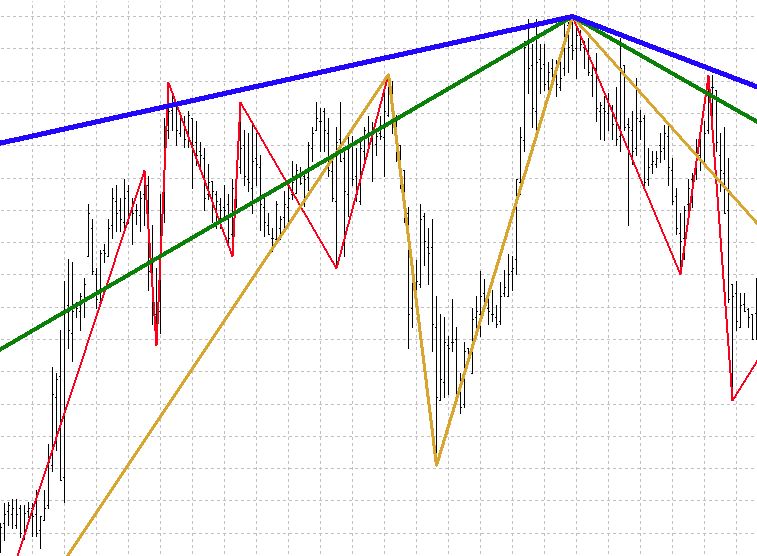
- Blue line: 5% deviation (highest deviation value, least elastic to changes)
- Green line: 3% deviation
- Yellow line: 1.5% deviation
- Red line: 1% deviation (lowest deviation value, most elastic to changes)
Peak Analysis Backstep
- Default: 3
Backstep reflects the minimum amount of bars between which the high and low can be plotted, you can think of this of the total width of the potential fib retracement/extension based off candlestick width periods. These settings should be adapted to various financial markets and you will probably end up using different settings for one market, instrument, price/harmonic pattern, and so fourth. Additionally, you could also end up changing the settings for the same market or indicator when the market conditions change along with its volatility.
Backstep – the parameter allows to specify the number of bars backwards from the current bar to be used for an assessment triggered by reaching or surpassing the Deviation parameter’s value. The possible values are from 1 through 10,000. The default value is 3. The smaller the number is, the shorter the segments are and the line changes its direction more often. The greater the number is, the longer the segments are, and the line changes its direction less frequently. A trader chooses the Backstep parameter’s value in accordance with what chart figures need to be identified. For identifying Elliott Waves, for example, the commonly used value is the default one – 3.

Above you can see examples of ZIGZAG indicators with different Backstep parameter’s values (1, 14, 27) drawn in additional areas.
Show ABCD
- Default: false
Show 3 Drives
- Default: false
Show Gartley
- Default: true
Show Butterfly
- Default: true
Show Bat
- Default: true
Show Alternate Bat
- Default: false
Show Deep Bat
- Default: false
Show Crab
- Default: true
Show Deep Crab
- Default: true
Show Cypher
- Default: true
Show Shark
- Default: true
Bars Back
The amount of bars to scan back from the current bar, try to keep this to a minimum to avoid over consumption of client resources.
- Default: 5000
Bullish Colour
- Default color: Lime
Bearish Colour
- Default color: Red
SL Color
- Default color: Red
TP[1] Color
- Default color: DarkGreen
TP[2] Color
- Default color: Green
TP[3] Color
- Default color: Lime
Data Color
- Default color: Light Blue
Info Panel Pixel Shift
- Default: 0
- For resolutions higher than 1080p such as 2k, 4k, etc: 5-20.
Enable Alerts
- Default: true
Mobile Alerts
- Default: false
Mail Alerts
- Default: false
Projection Alerts
- Default: false
References
https://algorush.com/wiki/harmonic-patterns-indicator
https://algorush.com/trading-systems-for-metatrader/harmonic-patterns-indicator/

Start Harmonic Trading
Learn Harmonic Patterns
Recent Trading Guides
-
December 18, 2020
Harmonic Patterns Explained For Beginners
-
November 17, 2020
Trading Breakouts within Price Action & Multiple Indicators
-
October 28, 2020
Importing High Quality Tick Data on MetaTrader 4 & 5
Looking for User Guides?
Instructions for Algo Rush Expert Advisors, Indicators & Dashboards.
Trading Systems
-
From: $19.99 / month with 1 week free trial
Harmonic Pattern Dashboard
Harmonic Patterns Dashboard
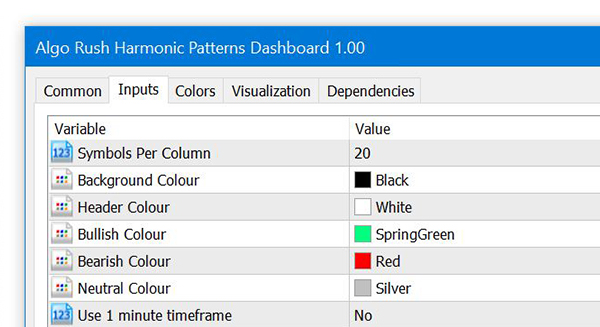
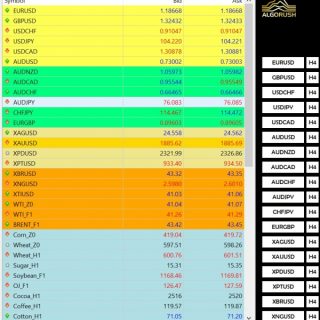
The harmonic patterns dashboard is exclusively available on MetaTrader 5 only. The harmonic pattern dashboard is capable of monitoring dozens of pairs while offering up to 21 different timeframes for each pair. When loading many pairs with all patterns enabled, please note that a PC or VPS with sufficient amounts of RAM and CPU cores will be required since this trading system is heavily math based.

Harmonic Patterns Dashboard Settings on MetaTrader 5
Symbols (Format=”GBPUSD,EURUSD”)
Leave this blank to have the symbols in the Market Watch window used. See image below:
- Default: (blank – uses the symbols in Market Watch instead)
- Type a pair such as GBPUSD to override fetching from the Market Watch.
- Seperate each pair with a comma only and no space.
- Example: GBPUSD,EURUSD,XAUUSD,USDCAD,BTCUSD
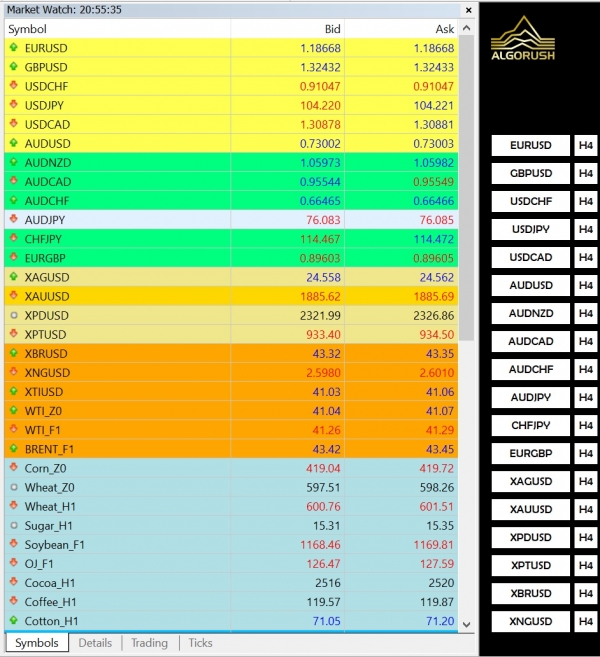
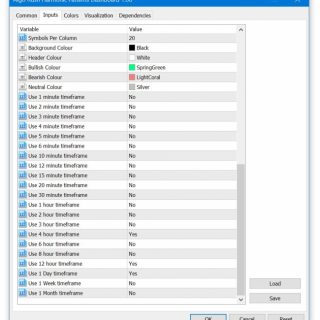
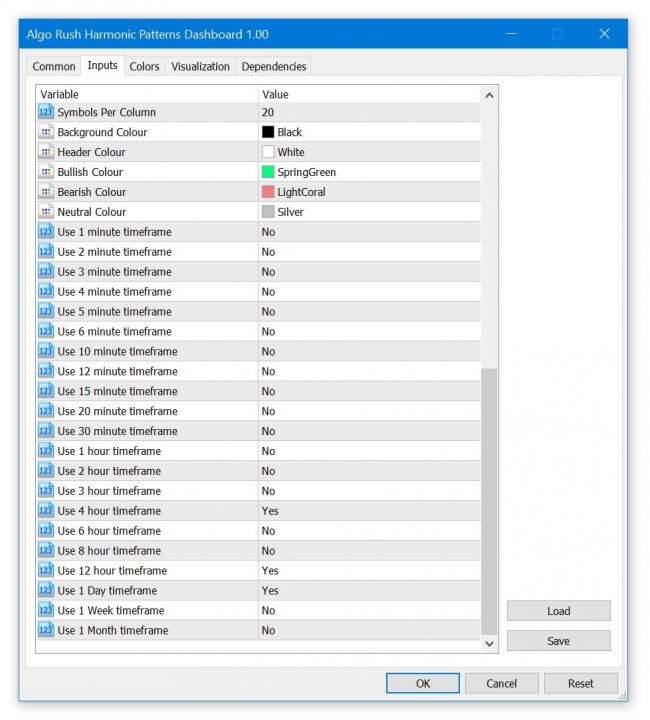
Symbols Per Column
This will define how many symbols/rows each column contains within the dashboard. Adjusting this is helpful if users either have ultra-wide or portrait orientation displays.
- Default: 20
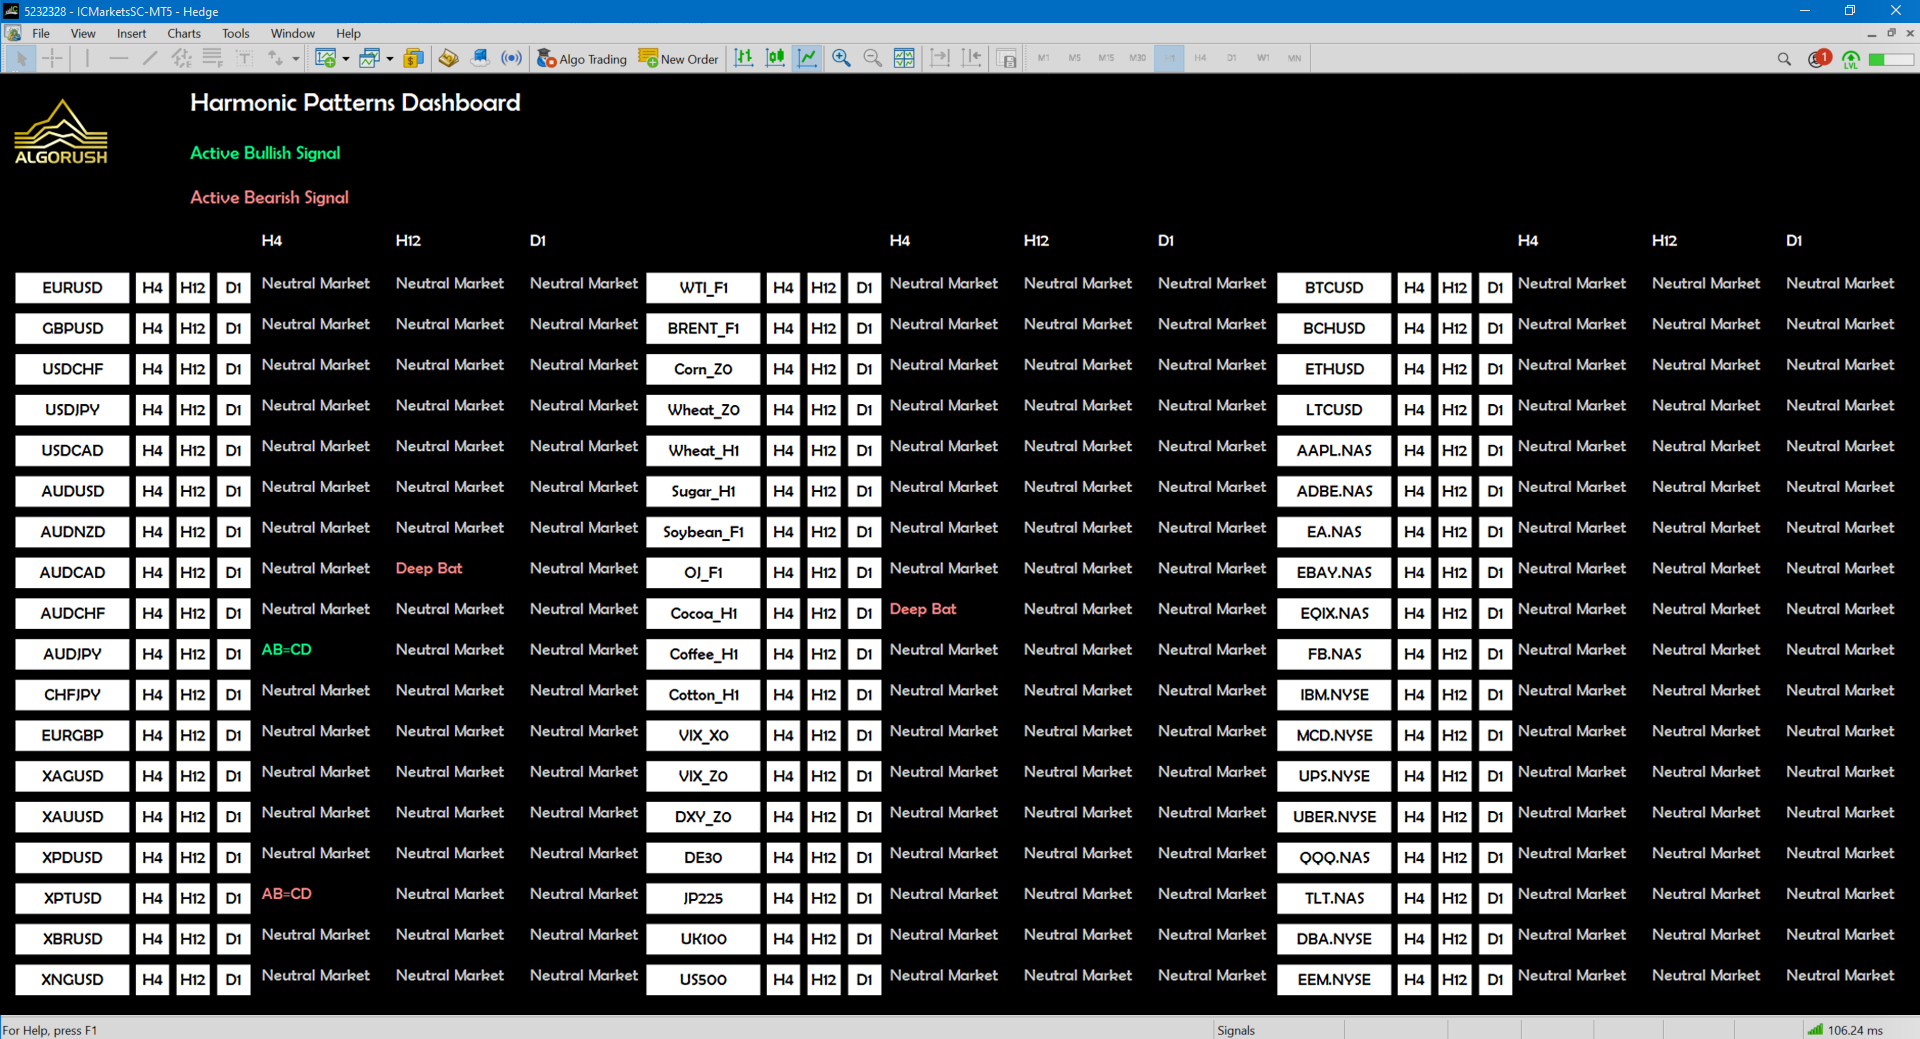
In this example, we used 18 as the value for the symbols per column since we loaded 52 pairs on 3 rows.
Background Colour
- Default: Black
Header Colour
Change only when the default background colour is changed from black to a lighter colour.
- Default: White

Bullish Colour
- Default: SpringGreen

Bearish Colour
- Default: LightCoral

Neutral Colour
- Default: Silver

Use 1 minute timeframe
- Default: No
Use 2 minute timeframe
- Default: No
Use 3 minute timeframe
- Default: No
Use 4 minute timeframe
- Default: No
Use 5 minute timeframe
- Default: No
Use 6 minute timeframe
- Default: No
Use 10 minute timeframe
- Default: No
Use 12 minute timeframe
- Default: No
Use 15 minute timeframe
- Default: No
Use 20 minute timeframe
- Default: No
Use 30 minute timeframe
- Default: No
Use 1 hour timeframe
- Default: No
Use 2 hour timeframe
- Default: No
Use 3 hour timeframe
- Default: No
Use 4 hour timeframe
- Default: Yes
Use 6 hour timeframe
- Default: No
Use 8 hour timeframe
- Default: No
Use 12 hour timeframe
- Default: Yes
Use 1 Day timeframe
- Default: Yes
Use 1 Week timeframe
- Default: No
Use 1 Month timeframe
- Default: No
References
https://algorush.com/wiki/harmonic-patterns-dashboard
https://algorush.com/trading-systems-for-metatrader/harmonic-patterns-dashboard/

Start Harmonic Trading
Learn Harmonic Patterns
Recent Trading Guides
-
December 18, 2020
Harmonic Patterns Explained For Beginners
-
November 17, 2020
Trading Breakouts within Price Action & Multiple Indicators
-
October 28, 2020
Importing High Quality Tick Data on MetaTrader 4 & 5
Looking for User Guides?
Instructions for Algo Rush Expert Advisors, Indicators & Dashboards.
Trading Systems
-
From: $19.99 / month with 1 week free trial
Harmonic Pattern Expert Advisor
Harmonic Patterns Expert Advisor (EA)
The Harmonic Patterns EA is available on MetaTrader 4 (MT4) and MetaTrader 5 (MT5). Trade over twelve harmonic patterns and use either the Potential Reversal Zone (PRZ) or the Pattern Completion Zone (PCZ) to determine key reversal and turning points.

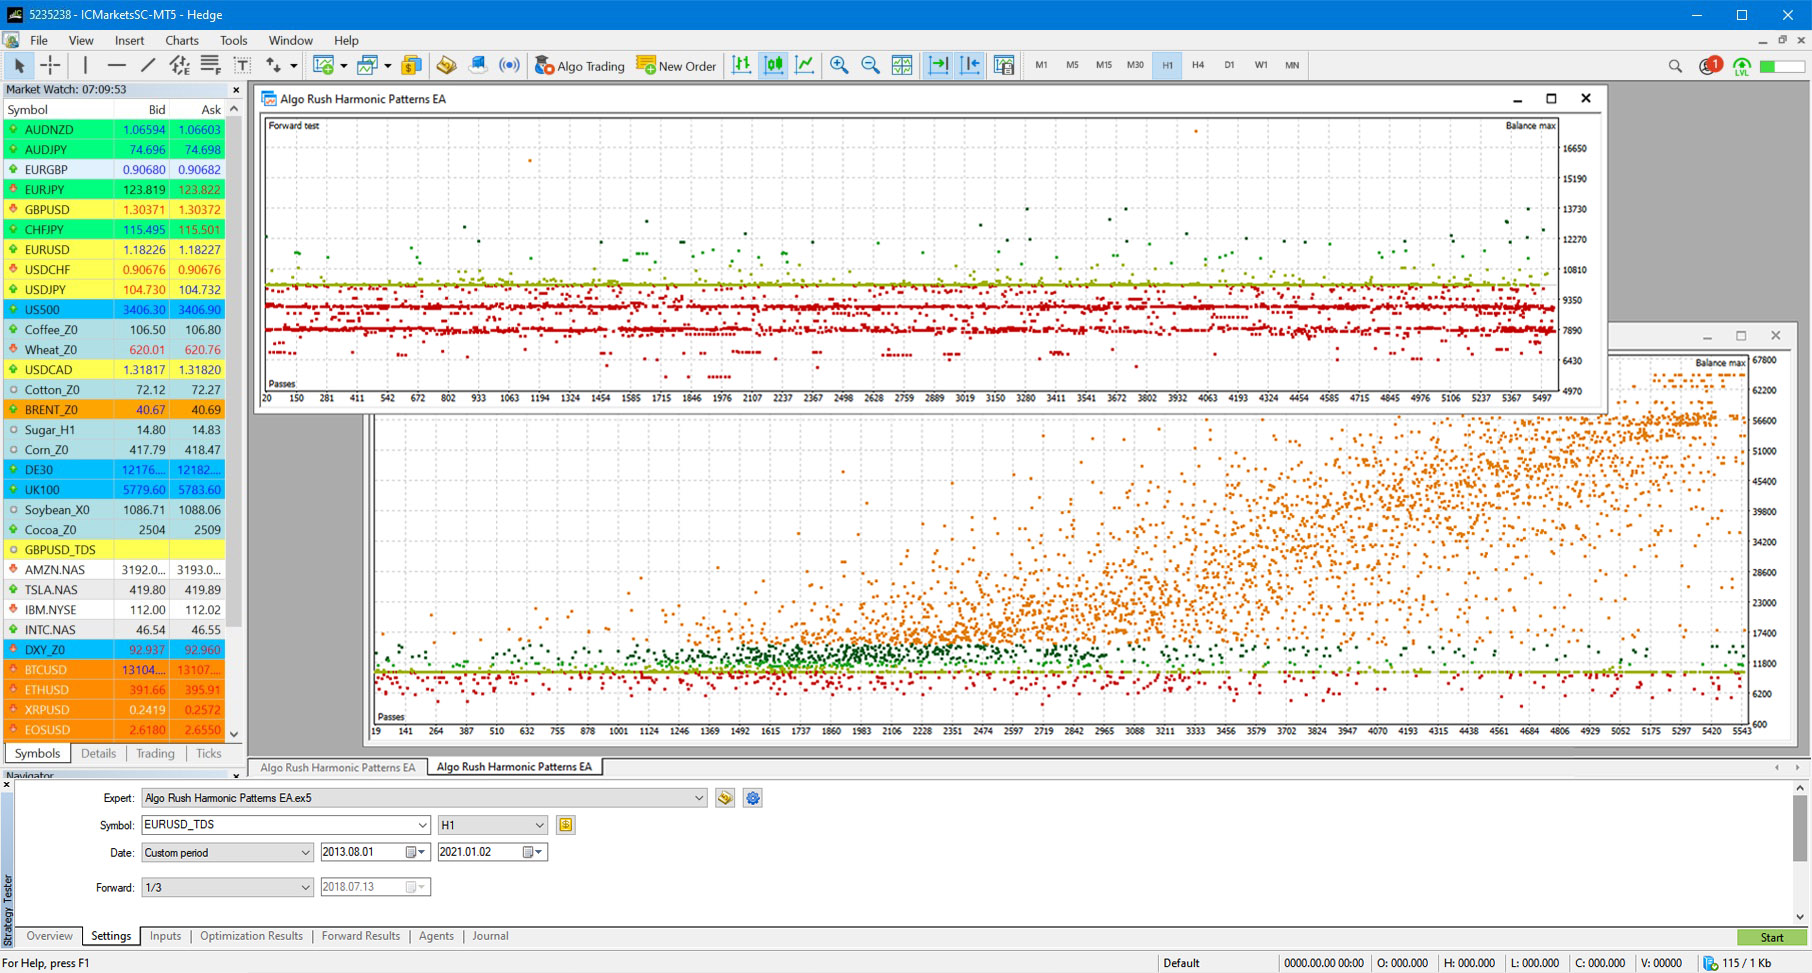
Walk-forward genetic optimizations with at least 3-5 years of sample data should be used to ensure accurate forward results. Read our article for importing tick data on MetaTrader 4 & 5 here.
One consideration to note; volume tick data provided by brokers either real-time or historically are skewed since their liquidity providers typically do not give an accurate representation of the market’s depth. Therefor we have made this system based purely off price action with no reference to tick volume within any of the trend modifiers.
Harmonic Patterns Expert Advisor (EA) Settings on MetaTrader 4 & 5
Algo Rush Account Email
The email address that the active Algo Rush subscription is under.
- Note: The indicators and Expert Advisors will not initiate without an email address linked to an active subscription.
Scaling Mode (Resolution & DPI)
Users with either resolutions above 1080p (1920×1080) or DPIs above 96 will need to adjust the scaling mode settings to an option above the default 100% value. Adjusting this will resolve any issues with displaying objects such as text, buttons and windows within active charts.
- 100% or 96 DPI (default)
- 125% or 120 DPI
- 150% or 144 DPI
- 175% or 168 DPI
- 200% or 192 DPI
- 225% or 216 DPI
- 250% or 240 DPI
EA Magic Number
This number must be unique for every EA loaded. If the users forgets to change this, there will be errors within the MetaTrader client.
- Note: Any number such as 832855
Max. # Open Baskets (3/Basket)
The maximum number of baskets (signals) that can be open at the same time. Within a basket each position is one of the 3 TP levels. If only two out of the three TP levels are being used, then the basket will consist of two positions that have the same entry and their own TP levels.
- Default: 1
Trade Direction
This number must be unique for every EA loaded. If the users forgets to change this, there will be errors within the MetaTrader client.
- Long & Short (Default)
- Long Only
- Short Only
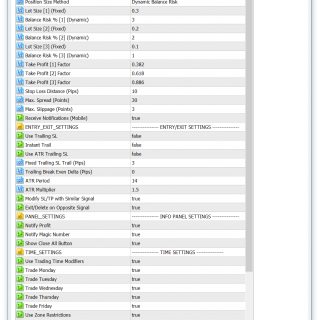
Position Size Method
The method used to allocate the amount used for each lot size within one trading setup.
- Dynamic Balance Risk (default)
- Fixed
Lot Size [1] (Fixed)
- Default: 0.3
Balance Risk % [1] (Dynamic)
- Default: 3
Lot Size [2] (Fixed)
- Default: 0.2
Balance Risk % [2] (Dynamic)
- Default: 2
Lot Size [3] (Fixed)
- Default: 0.1
Balance Risk % [3] (Dynamic)
- Default: 1
TP1 Factor
It’s first multiplier with fibo range for determining First take profit level.
- Default: 0.382
TP2 Factor
It’s second multiplier with fibo range for determining second take profit level.
- Default: 0.618
TP3 Factor
It’s third multiplier with fibo range for determining third take profit level.
- Default: 0.886
Stop Loss Distance (Pips)
You can increase SL level by increasing this value, it’s simply just additional pips to stop loss fib level.
- Default: 30
Max. Spread (Points)
- Default: 30
Max. Slippage (Points)
- Default: 3
Use Trailing SL
Must be enabled for any of the trailing options to work.
- Default: false
Instant Trail
When enabled, the trailing will begin early when ATR is activated before price reaches even TP1.
- Default: false
Use ATR Trailing SL
When enabled, the trailing will begin when ATR is activated rather than after TP1 or TP2.
- Default: false
Fixed T. SL Trail (Pips)
The fixed trailing stop loss in pips that is activated at Level C (default level for level C is 0.66 on the trend fib).
- Default: 0
Trail BE Delta (Pips)
The trailing breakeven offset that could be added to account for fees when adjusting the breakeven in pips.
- Default: 0
ATR Period
- Default: 14
ATR Multiplier
- Default: 1.5
Modify SL/TP with Similar Signal
Leave enabled to have your position’s take profit and stop loss updated when a new signal in the same direction is generated.
- Default: true
Exit/Delete on Opposite Signal
Leave enabled to have your long sell when a short signal confirms and vice versa.
- Default: true
Notify Profit
- Default: true
Notify Magic Number
- Default: true
Show Close All Button
Strongly recommended to have enabled.
- Default: true
Info Panel Pixel Shift
For resolutions higher than 1080p such as 2k, 4k, etc: 5-20.
- Default: 0
Use Trading Time Modifiers
- Default: true
GMT Open Hour
- Default: 0
GMT Open Minute
- Default: 1
GMT Close Hour
- Default: 23
GMT Close Minute
- Default: 59
GMT Close Minute (Friday)
Used when “Weekend Close Out” is enabled.
- Default: 57
Weekend Close Out
The position will close out before going into the weekend. Disable this option to have keep your position in an active during weekend closes.
- Default: false
Weekend Close Shift (Hours)
If “Weekend Close Out” is enabled, the position will close out starting from the minutes defined for the Friday (weekend) close minutes. To set the offset to one hour or more before, increase this value (defined in hours).
- Default: 3
References
https://algorush.com/wiki/harmonic-patterns-expert-advisor
https://algorush.com/trading-systems-for-metatrader/harmonic-patterns-expert-advisor/

Start Harmonic Trading
Learn Harmonic Patterns
Recent Trading Guides
-
December 18, 2020
Harmonic Patterns Explained For Beginners
-
November 17, 2020
Trading Breakouts within Price Action & Multiple Indicators
-
October 28, 2020
Importing High Quality Tick Data on MetaTrader 4 & 5
Looking for User Guides?
Instructions for Algo Rush Expert Advisors, Indicators & Dashboards.
Trading Systems
-
From: $19.99 / month with 1 week free trial
Potential Reversal Zone
What is the Potential Reversal Zone (PRZ)?
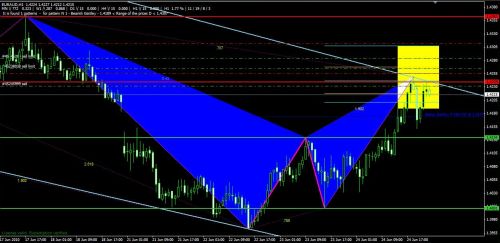
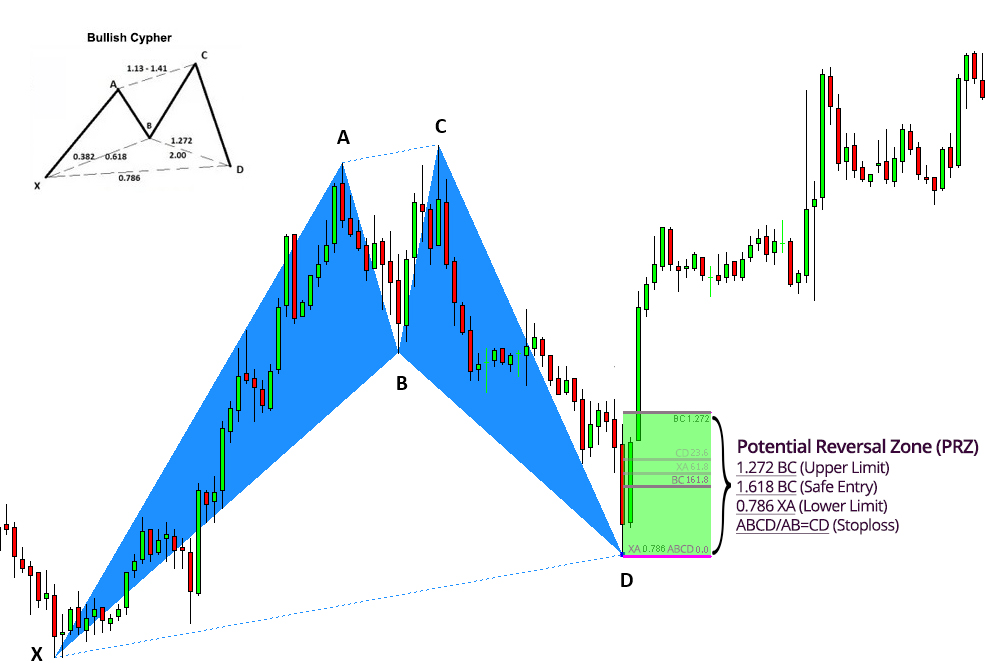
The PRZ, the Potential Reversal Area, is an area where 3 or more Fibonacci numbers converge, and where the harmonic pattern completes. It’s the D point on a harmonic pattern and where price has a high probability of reversing.
In the example below with the bearish Gartley pattern, the yellow rectangle is the PRZ where the Fibonacci projections (yellow and blue horizontal lines) for this pattern converge with other each other.
In the case of the bearish Gartley pattern the key Fibonacci projections to converge in the PRZ are the 0.786 XA, 1.27 BC, 1.618 BC and the level where AB=CD.
To illustrate a more in depth example, the Potential Reversal Zone (PRZ) for the Bullish Gartley pattern is constructed using the following Fibonacci extensions and projections:
-
-
- 0.78 XA
- 1.27 BC
- 1.62 BC
- AB = CD
-
Below illustrates the ratios for all legs and how they are used for determining a pattern’s PRZ.

Below is an example of real-world Potential Completion Zone (PCZ) formation:
References
https://patternswizard.com/5-0-harmonic-pattern/
https://harmonictrader.com/harmonic-patterns/5-0/
https://www.liteforex.com/blog/for-beginners/5-0-pattern-shark-hunt/
https://www.orbex.com/blog/en/2017/03/catch-key-reversals-5-0-pattern
https://algorush.com/trading-academy/advanced-lessons/harmonic-patterns/harmonic-trading-patterns/5-0-pattern/
Start Harmonic Trading
Learn Harmonic Patterns
Recent Trading Guides
-
December 18, 2020
Harmonic Patterns Explained For Beginners
-
November 17, 2020
Trading Breakouts within Price Action & Multiple Indicators
-
October 28, 2020
Importing High Quality Tick Data on MetaTrader 4 & 5
Looking for User Guides?
Instructions for Algo Rush Expert Advisors, Indicators & Dashboards.
Trading Systems
-
From: $19.99 / month with 1 week free trial
Pattern Completion Zone
What is the Pattern Completion Zone (PCZ)?
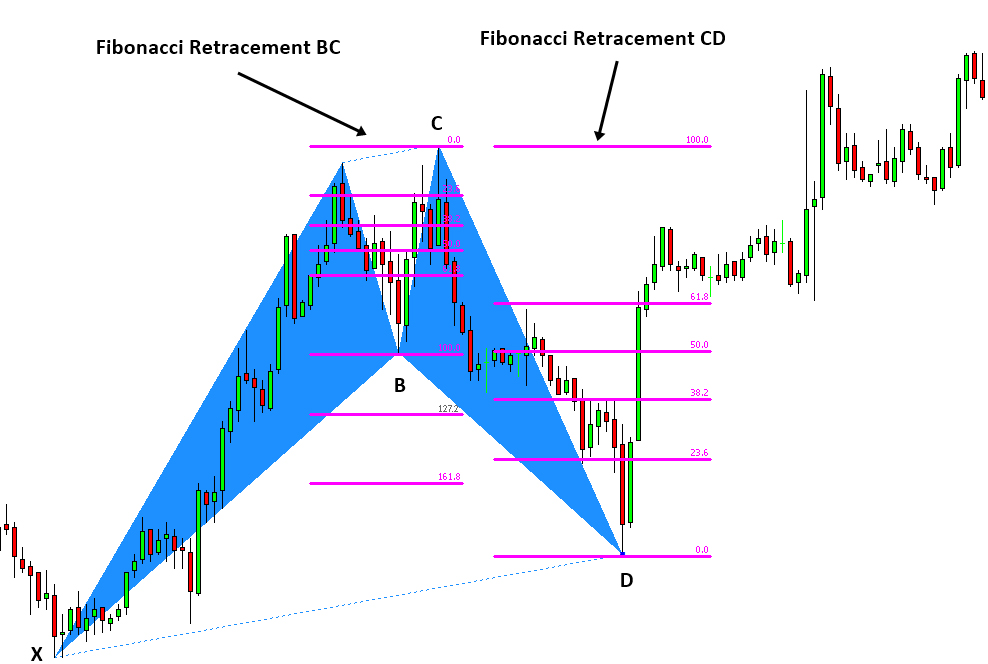
All harmonic patterns have a defined Pattern Completion Zone (PCZ) which are also known as price clusters that are formed by the completed swing (leg) at point D. The PCZ is the confluence of Fibonacci extensions, retracements and price projections for all legs within a harmonic pattern structure. Price action generally reverse within these patterns once the CD leg has been formed and confirmed. The price action’s reverse move from point D is what is known as the Pattern Completion Zone and any trades anticipated in this zone should be entered/closed based off the price reversal action levels displayed by the PCZ.
The Pattern Completion Zone (PCZ) is also referred to as the Potential Continuation Zone and is used on top of the Potential Reversal Zone (PRZ) methodology to predict future price movements from the structure’s confirmed D point instead of relying on generic Fibonacci retracement levels. The levels for the Pattern Completion Zone (PCZ) is constructed after the final point D is formed in the harmonic pattern’s structure. The levels which the PCZ produces are geared towards providing traders with potential key reversal and trend correction levels to use as maximum limits for take-profits and stoplosses.
The following Fibonacci retracements are used to construct the PCZ:
-
-
- XA
- BC
- CD
- AB=CD (applicable to XABCD/4-legged patterns only)
-
The Pattern Completion Zone (PCZ) is used by traders to help determine which levels to place take-profit and stoploss orders on while the the Potential Reversal Zone (PRZ) is used in calculating an approximate range to enter once the D point (4th leg) has been confirmed.
Example 1: Potential Reversal Zone on the Cypher Pattern
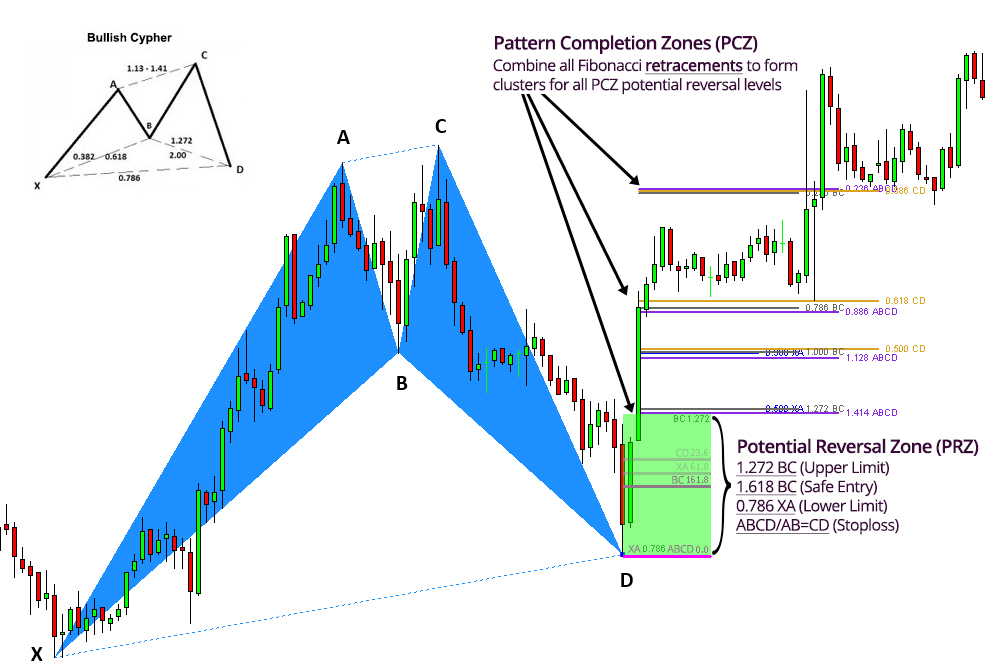
To demonstrate the PCZ, we will use a bullish Cypher to break down the retracements for each leg. Use the ratios from the diagram below when reading forward.
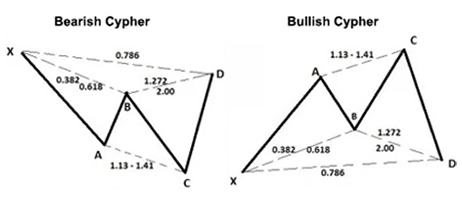
In the bullish Cypher example below, we will use the same PCZ retracement legs along with specific ratios. Some ratios within each of the legs listed below are used for the PRZ instead thus not being included in the diagram below.
Ratios used within each leg on the bullish Cypher pattern:
-
-
- XA (0.386, 0.500)
- BC (0.236, 0.786, 1.000, 1.272)
- CD (0.500, 0.618, 0.886)
- AB=CD (valid)
-

Once the Fibonacci retracements for XA, AB, BC and CD have been formed, their retracement levels (no extensions) can be combined then grouped into clusters which will help give traders a better understanding to where important levels of resistance or support may be waiting. It is also wise to set take-profit and stop loss levels on these cluster levels instead of relying on generic Fibonacci extensions (0.382, 0.618, 0.886) from point D.
Example 2: Potential Reversal Zone on the bullish Alternate Bat
In this example we used the Alternate Bat pattern on the Harmonic Patterns Trading System. The PCZ retracement levels are projected as well the generic Fibonacci extension TP levels are also illustrated to show the difference between using clusters vs. using Fibonacci extension (0.382, 0.618, 0.886).
Note: we refrained from showing the PRZ in this example to illustrate what a projection with only PCZ levels looks like. As well consider that the lower PCZ levels are not accounted for when forming clusters.
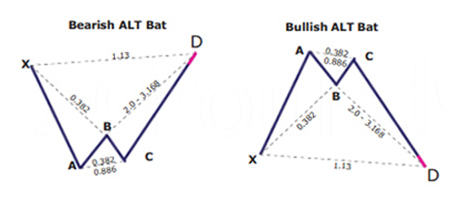
PCZ ratios used within each leg on the Alternate Bat pattern:
-
-
- XA (0.386, 0.500)
- BC (0.386, 0.618, 0.886, 1.00)
- CD (0.386, 0.500, 0.618, 0.886)
- AB=CD (0.386, 0.500, 0.618)
-
References
https://www.tradingview.com/ideas/pcz/
https://www.futuresmag.com/2016/11/29/trading-abc-patterns
https://school.stockcharts.com/doku.php?id=trading_strategies:harmonic_patterns
https://algorush.com/trading-academy/advanced-lessons/harmonic-patterns/reversal-and-turning-point-methods/pattern-completion-zone-pcz/
Start Harmonic Trading
Learn Harmonic Patterns
Recent Trading Guides
-
December 18, 2020
Harmonic Patterns Explained For Beginners
-
November 17, 2020
Trading Breakouts within Price Action & Multiple Indicators
-
October 28, 2020
Importing High Quality Tick Data on MetaTrader 4 & 5
Looking for User Guides?
Instructions for Algo Rush Expert Advisors, Indicators & Dashboards.
Trading Systems
-
From: $19.99 / month with 1 week free trial
5-0 Pattern
What is the 5-0 harmonic pattern?
Just as it is with the shark pattern, the 5-0 harmonic pattern is a relatively new pattern discovered by Scott Carney. Carney spoke about this pattern in the second book in his harmonic series, ‘Harmonic Trading: Volume Two’.
The 5-0 pattern is easily one of the wonkiest looking patterns. Depending on the amount of knowledge you have about harmonic patterns, the 5-0 will look different, and this is mainly because the 5-0 pattern begins a 0. If you are familiar with seeing XABCD, then 0XABCD will undoubtedly look different.
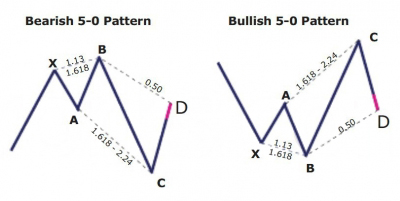
Key takeaways:
- The 5-0 pattern is a reversal harmonic pattern.
- It follows specific fibonacci ratios (which you can read more below)
The patterns are relatively new but are getting more popular lately. It stands out from the other harmonic patterns because it is meant to begin a new trend rather than discover retracement. There are two types of this pattern, bullish and bearish.
The convergence zones discovered with the help of the shark pattern makes it possible for us to accurately detect the rebound but doesn’t necessarily lead to the restoration of the previous trend. On the other hand, regular rollbacks aim to determine the ability of the forces dominant on the market in the previous period (bears or bulls) to get the initiative back to their disposal. If they are not sufficient, the last reversal of the previous trend occurs, but already within another pattern – 5-0 harmonic pattern.
How to identify the 5-0 pattern?
The 5-0 pattern begins with either an uptrend or a downtrend which gets exhausted and draws zigzag like corrective movements. The qualities of the 5-0 pattern to look at include:
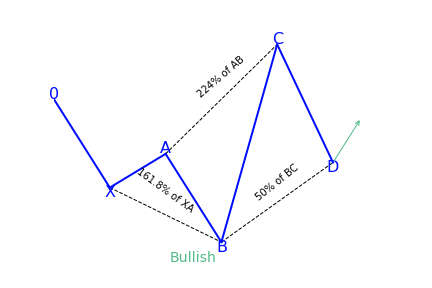
- AB movement has to be 1.13 to 1.618 retracement of XA.
- BC movement has to be 1.618 to 2.24 retracement of an AB.
- CD movement ought to be 0.5 retracements of BC
- C should be between 0.886 and 1.13 of 0X movement
If the conditions are satisfied, some traders trade the last leg of CD. They entering at C with a stop below 2.24 of AB retracement and aiming at 50 percent correction of BC movement.
The 5-0 harmonic pattern is traded when the price is getting to point D. The stop-loss is positioned a few ticks below/above the farthest possible D level. Unlike a lot of the other patterns, 5-0 doesn’t have specific targets because it usually begins a new trend. Here the pattern fib ratios don’t matter much. Entries might be done with a limit order or on price reversals away from point D. All entries have to be confirmed for risk/reward ratio. Entries having less risk/reward have to be taken cautiously or discarded altogether.
A reliable indicator should automatically scan for, recognize, display, and alert emerging 5-0 and other harmonic chart patterns. It indicates the name of the pattern, when it happened, and the stop price. The pattern scanner goes through various charts in the same period and assists traders to find trading opportunities as soon as they come up.
Bearish 5-0 pattern
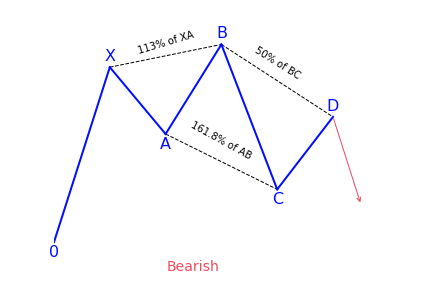
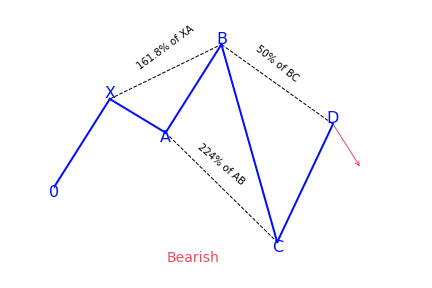
To correctly identify the bearish 5-0 pattern, first, find the shark pattern, wait for the implementation of its targets at 88.6 or 113 percent, and the following rollback in the direction of 50 percent of the BC wave. The length of this wave in both graphic configurations is 161.8 to 224 percent of AB. If after the convergence zones of the shark pattern is reached, a correction in the direction of 23.6 percent, 38.2 percent, or 50 percent has followed, we can talk about the transformation of the real pattern into 5-0.
Bullish 5-0 pattern
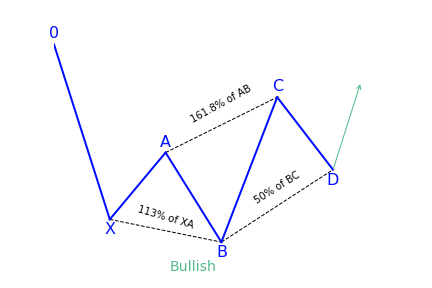
After the target at 113 percent of the shark harmonic pattern was achieved, it was followed by a rollback in the direction of 38.2 percent of the CD wave. The trader has to search for this place for confirmation signals to create a long position. It can be both indicators, prompts from price action, or other items and techniques used for technical analysis.
What does the 5-0 pattern tell traders?
The 5-0 harmonic chart pattern suggests a long entry upon completion of the pattern or confirmation of the D point of the pattern. The pattern is a unique 5-point reversal structure that typically shows the first pullback of an important trend reversal. It is a relatively new pattern that has 4 legs and particular Fibonacci measurements of each point within the structure, creating room for better flexible interpretation. The Potential Reversal Zone (PRZ) is described differently from other harmonic chart patterns.
Conservative traders look for more confirmation before getting into a trade. Targets for this pattern can be placed at the discretion of the trader as the reversal point could be the beginning of a new trend. Common stop-loss levels are found behind a structure level beyond the D point or the next vital level for the Fibonacci sequence.
How to trade when you see the 5-0 pattern?
One of the best processes of interpreting this pattern is to look at it from a tired and frustrated trader’s point of view. Taking the bullish 5-0 pattern as an example, then we can see why. The AB leg ends with B below X, making a lower low. We then get a longer move in time where the BC leg is the most prolonged move with C ending over A.
The movement from B to C may look like a bear flag or bearish pennant. C to D indicates intense shorting pressure and a belief among bears that new lows are on the way. Rather, we get to D – the 50 percent retracement of BC. Rather than new lower lows, we get a confirmation swing forming a higher low. That move will most probably create a brand new trend reversal or significant corrective move.
The elements of trading the 5-0 pattern
- The pattern starts (with 0) at the beginning of a long price move
- After 0 has formed, an impulse reversal at X, A, and B should have a 113 to 161.8 percent extension
- The projection off of AB has a 161.8 percent extension requirement to C. C can extend beyond the 161.8 percent extension but not beyond 224 percent.
- D is the 50 percent retracement of BC and is same as AB
- The reciprocal AB=CD is needed
Drawing the 5-0 pattern properly
To perfectly draw or locate a 5-0 harmonic chart pattern on the price chart, first of all, we need to locate the X and A points of the pattern. The X point is seen at the bottom of a strong bearish trend. The A point is found at the top of a bullish trend. The next thing traders need to do is to draw a Fibonacci retracement tool from X to A to determine the B point of the chart pattern. The B point should be within the 113 percent to 161.8 percent Fibonacci retracement of XA.
In the last step, we will get the entry point, D point, of the 5-0 harmonic chart pattern. To get the D point of the pattern, draw a Fibonacci retracement tool from B to C. The D point has to be at the 50 percent Fibonacci retracement of BC.
Traders can be sure when the D point of the pattern is confirmed. The stop-loss for the order should be set at the lower support level. The profit target for the order should be placed within the 50 to 88.6 percent Fibonacci retracement of CD.
The C axis can also be traded, if it is the D point of a bearish harmonic chart pattern. The B point can be traded if the entries are confirmed by the other tools for technical analysis.
References
https://patternswizard.com/5-0-harmonic-pattern/
https://harmonictrader.com/harmonic-patterns/5-0/
https://www.liteforex.com/blog/for-beginners/5-0-pattern-shark-hunt/
https://www.orbex.com/blog/en/2017/03/catch-key-reversals-5-0-pattern
https://algorush.com/trading-academy/advanced-lessons/harmonic-patterns/common-harmonic-patterns/5-0-pattern/
Start Harmonic Trading
Learn Harmonic Patterns
Recent Trading Guides
-
December 18, 2020
Harmonic Patterns Explained For Beginners
-
November 17, 2020
Trading Breakouts within Price Action & Multiple Indicators
-
October 28, 2020
Importing High Quality Tick Data on MetaTrader 4 & 5
Looking for User Guides?
Instructions for Algo Rush Expert Advisors, Indicators & Dashboards.
Trading Systems
-
From: $19.99 / month with 1 week free trial
AB=CD Pattern
What is the AB=CD (ABCD) harmonic pattern?
Created by Larry Pesavento and Scott Carney, after being discovered originally by H. M. Gartley, the AB=CD trading pattern has become very effective as a trading technique for technical traders. This trading pattern helps you to identify when the price is about to change direction. The idea is that you can purchase when the price is low and about to rise or sell when the price is high and is about to go down. It is a well-known harmonic group of patterns. Some traders sometimes also refer to it as ABCD pattern.
Key takeaways:
- The AB=CD harmonic is reversal pattern
- Depending on the context, it can be bullish or bearish
- It should follow specific Fibonacci ratios :
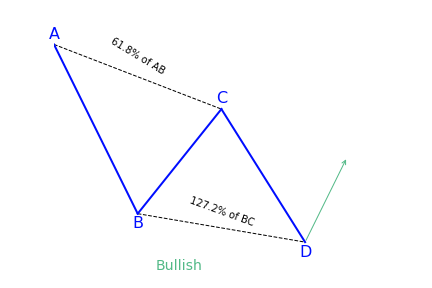
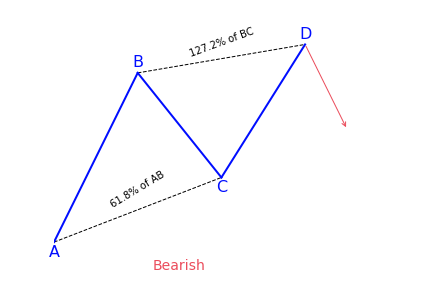
- BC is the 61.8 percent Fibonacci retracement of AB
- CD is the 127.2 percent Fibonacci extension of BC
The AB=CD pattern is considered the simplest harmonic pattern because it has significantly less requirements than most of the other harmonic setups. In addition to that, the AB=CD formation is much easier to detect on the price chart.
After weeks of research, back testing and live trading, experts feel comfortable to recommend this setup to traders.
There are two types of AB=CD (ABCD) patterns
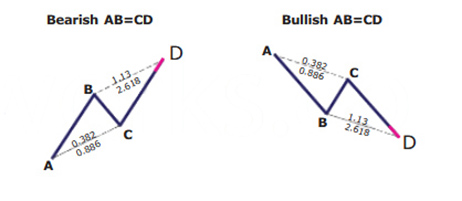
There are two types of AB=CD trading patterns – the bullish AB=CD and the bearish AB=CD.
Bullish AB=CD (ABCD)
This pattern begins with a decrease in price (AB), followed by a reversal and a rise (BC). The BC move then reverses into a new bearish move (CD), which goes below the bottom made at point B. It is expected that there will be a reversal and an increase in price after the price completes the CD move.
Bearish AB=CD (ABCD)
This chart pattern is the same as the bullish AB=CD pattern, but it is upside down. The pattern starts with a bullish AB line, which can be reversed by a new bearish move. The BC move then gets reversed by a new bullish move, which goes above the top point. After noticing these qualities, traders can expect the price to reverse again, creating a new bearish run.
How does Fibonacci Ratios integrate with the pattern?
This pattern needs to conform to particular Fibonacci ratios. Usually, there are two Fibonacci rules associated with the ABCD figure:
- BC is the 61.8 percent Fibonacci retracement of AB
- CD is the 127.2 percent Fibonacci extension of BC
When trading the ABCD pattern, always conform to the Fibonacci levels. There are various indicators to assist you in confirming the patter requirements.
What does the AB=CD (ABCD) trading pattern tell traders?
Usually, the price action behavior of the ABCD pattern begins with the price going in a new direction A, which later creates a swing level B, then retraces a portion at C, and finally resumes to take out the important swing at the second position. It continues until it gets to a distance equivalent to AB or D. When the CD portion gets to an equivalent distance to AB, it is expected that there will be a reversal of the CD price move. At the same time, BC and CD will respond to particular Fibonacci levels.
When there’s a confirmation of AB=CD pattern, traders look to set entry points on the chart at the beginning of the emerging reversal after the CD move. The idea is to enter the market early enough with a trading position just after the reversal of the CD move.
How to trade the AB=CD (ABCD) harmonic trading pattern?
General principle
Trading the ABCD pattern involves rules meant to guide people on how to enter trade, lock potential profits and exit with minimum loss if the market follows the opposite direction. The entry of a trade, whether buy or sell, triggers when the pattern is in place.
After the AB=CD harmonic pattern has been identified, you can start looking for a trading opportunity at point D. The buy and sell signals are generated after the final C to D leg, when a reversal is expected to occur. If the pattern is trending higher, traders can look to sell or enter a short position at point D. If the pattern is trending lower, it is advisable to buy the security at point D in anticipation of a turnaround.
Protect your trade
It is best to place stop-loss points just above or below point D, depending on the direction of the trade. If the move goes beyond that point, the chart pattern is invalidated and the reversal is less likely to happen. Take-profit points are placed by using the Fibonacci levels. For instance, traders might look for a move back to the original point A and move a trailing stop-loss to 28.2, 50, and 61.8 percent Fibonacci levels along the way.
Follow your strategy
Just as it is with other technical analysis, the AB=CD chart pattern best works when used along with other chart patterns or technical indicators. Also make use of volume as a confirmation of a reversal once the AB=CD pattern makes a prediction.
Study the chart looking at the highs and lows of the price. Observe the price as it forms AB and BC. For a bullish ABCD pattern, C has to be lower than A and should be the intermediate high after the low at B. Point D has to be a new low below B.
When the market gets to a point where D may be found, don’t rush into a trade. Make use of some techniques to ensure that the price reversed up, or down for a bearish ABCD. The best scenario is a reversal candlestick pattern. You can set a buy order at or over the high of the candle at point D.
Setting a profit target for your trade
One way of deciding where to take profits is by drawing a new Fibonacci retracement point from A to D of the pattern. If you are not sure the point to place your profit, set it at the 61.8 percent level, but closely observe how the price reacts around the levels. If the price finds it difficult to break through any of them, close your trade and take an early profit.
Summary
The AB=CD pattern is one of the most popular harmonic patterns. Since it often appears in practice, traders can use it together with other kinds of technical analysis to improve their chances of success. The secret is matching up Fibonacci levels and setting the right stop-loss and take-profits points to manage the trade. Since their appearance in 1935, harmonic patterns have gained momentum lately and have gone through several refinements. The addition of Fibonacci ratios and projections has given the specifications more detail.
References
https://patternswizard.com/abcd-harmonic-pattern/
https://learn.tradimo.com/advanced-chart-patterns/ab-cd-pattern
https://www.babypips.com/learn/forex/the-abcd-and-the-three-drive
https://www.forex.com/en/education/education-themes/technical-analysis/abcd-pattern/
https://algorush.com/trading-academy/advanced-lessons/harmonic-patterns/common-harmonic-patterns/abcd-pattern/
Start Harmonic Trading
Learn Harmonic Patterns
Recent Trading Guides
-
December 18, 2020
Harmonic Patterns Explained For Beginners
-
November 17, 2020
Trading Breakouts within Price Action & Multiple Indicators
-
October 28, 2020
Importing High Quality Tick Data on MetaTrader 4 & 5
Looking for User Guides?
Instructions for Algo Rush Expert Advisors, Indicators & Dashboards.
Trading Systems
-
From: $19.99 / month with 1 week free trial
Alternate AB=CD Pattern
What is the Alternate AB=CD (ABCD) harmonic pattern?
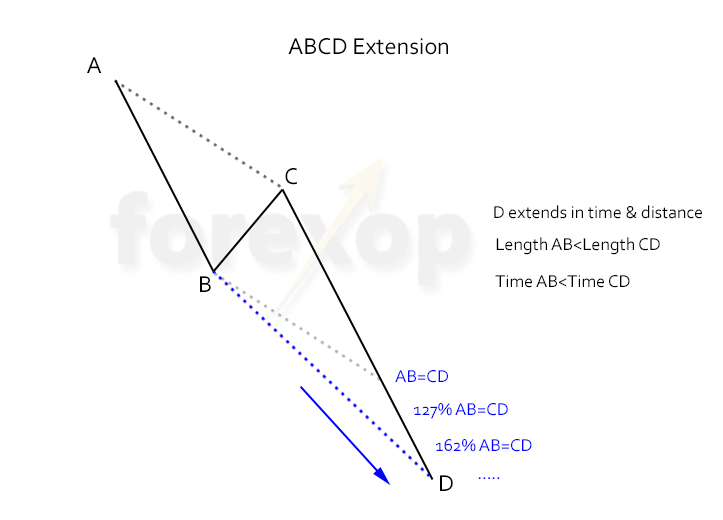
Many times ABCD patterns are not perfectly symmetrical or even close to. These are alternate ABCD patterns. The CD leg can be shorter or longer than the AB leg. But usually the CD leg is longer – these are called ABCD extensions. The Alternate AB=CD (also known as the Alternate ABCD) is an extension pattern which consists of 3 Fibonacci extension levels.
In an ABCD extension the retracement at D extends further than anticipated. The extension can be in time or price, but usually it’s both.
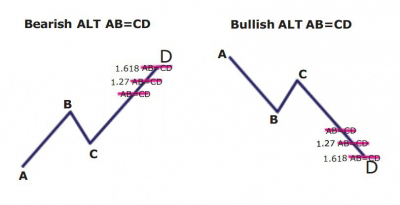
The common ABCD extension ratios are:
- CD = 127% x AB
- CD = 162% x AB
- CD = 262% x AB
When there’s an ABCD extension a bullish market makes higher highs than anticipated by the ideal pattern. In a bearish trend it’s the opposite, and the trend makes lower lows than otherwise predicted.
When checking an ABCD extension, anticipate higher volatility around point D.
Start Harmonic Trading
Learn Harmonic Patterns
Looking for User Guides?
Instructions for Algo Rush Expert Advisors, Indicators & Dashboards.
Gartley Pattern
What is the Gartley harmonic pattern?
The Gartley pattern is the most commonly used harmonic pattern that is based on Fibonacci numbers and ratios. This pattern offers assistance to traders in identifying reaction highs and lows. H.M. Gartley laid down the foundation for harmonic chart patterns in 1932 in his book ‘Profits in the Stock Market’.
A harmonic pattern operates on the basis that Fibonacci sequences can be applied in building geometric structures, like retracements and breakouts in prices. The Fibonacci ratio is common in nature. It has become a famous area of focus among technical analysts that use tools.
Key takeaways:
- The Gartley pattern is a 4-legged harmonic pattern
- It can be bullish or bearish
- It follows clear Fibonacci levels (see the Gartley ratios paragraph for detail)
This is one of the most traded patterns. It is a retracement and continuation pattern that is formed when a trend temporarily changes direction before continuing in its original direction. It provides a low-risk opportunity for traders to go into the market where the pattern finishes and the trend comes back.
How to identify the Gartley pattern?
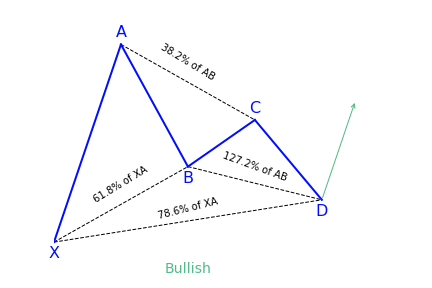
The Gartley pattern depends on various labeled points within a general movement in price. Most Gartley patterns are for overall bullish trends (as the point from X to A is moving upwards) that is currently experiencing a bearish retracement.
Since the pattern is a member of the Harmonic family, every swing has to conform to particular Fibonacci levels. We will now look at each component of the Gartley structure.
The Gartley Pattern Structure: Important Movements
X to A
The movement begins with X to A and there are no specifics for identifying the X to A leg of the Gartley pattern. In its bullish version, this first leg gets formed when the price sharply rises from point X to point A. This is the longest leg of the pattern.
A to B
This is where Fibonacci becomes relevant to the pattern. The distance between A and B should be close the size of the movement from X to A. The A-B leg will not retrace pass point X – if it does, the pattern is considered invalid.
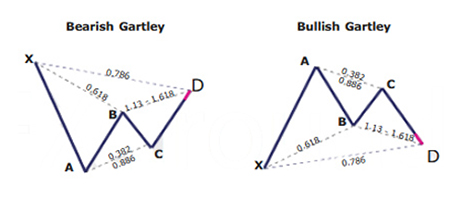
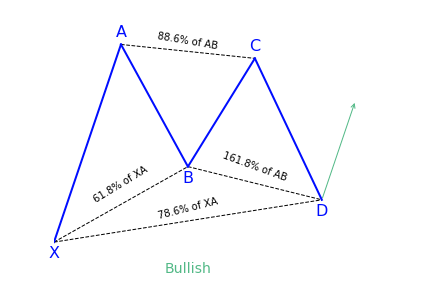
B to C
This movement should be a retracement of 38.2% or 88.6% of the movement of A to B. If the B to C move retraces above point A, the Gartley pattern is void.
C to D
This should be an extension of the B to C leg. The difference when trading this pattern is that you will place your trade entry at the point where the C to D leg has achieved a high percentage retracement of the X to A leg.
A to D
After the completion of C-D, traders should measure the overall movement of A to D. It should be a 78.6 percent retracement of the change in price of X to A.
Bullish and bearish Gartley pattern variations
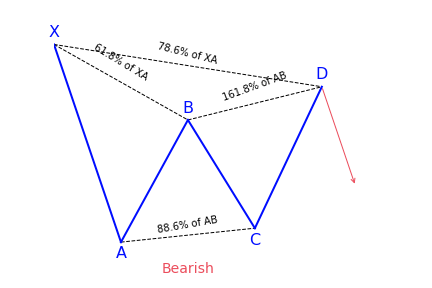
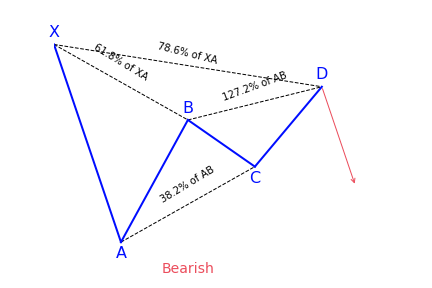
The bearish version of the Gartley pattern is just the opposite of the bullish pattern. It shows a bearish downtrend with several price targets when the pattern reaches completion by the fourth point.
What does the Gartley pattern tell traders?
A lot of technical analysts make use the Gartley harmonic pattern together with other chart patterns or technical indicators. For instance, the pattern can give a big picture overview of where the price is likely to go over the long-term. In the meantime, traders focus on executing short-term trades in the direction of the predicted trend. The breakout and breakdown price targets may also be used as support and resistance levels by traders.
The best part about these types of chart patterns is that they give particular knowledge about both the timing and magnitude of price movements rather than just look at one or the other.
Just as it is with other chart patterns, there is a bullish and a bearish version. The Gartley harmonic pattern includes the AB=CD pattern, this means that it is necessary for traders to study it before making any decision. The pattern is often known to as Gartley222 because Gartley first described it on page 222 of his book.
How to enter into a trade when you see the Gartley Pattern
To enter a Gartley trade you should first take note of the pattern and then confirm if it is valid or not. Outline the four price swings on the chart and check to make sure they respond to their respective Fibonacci levels to draw the Gartley pattern on your chart. Ensure you mark every price action swing with the important letters X, A, B, C, and D. By doing this, you will be able to estimate the overall size of the pattern and get a clear idea about the parameters.
If your chat is a bullish Gartley, open a long trade after noticing these conditions:
- CD gets support at 127.2 percent or 161.8 percent Fibonacci level of the BC move.
- The price action bounces in a bullish direction from the respective Fibonacci level.
If the Gartley pattern is bearish, then you make use of the same two rules to open a trade. But in this case, your trade will to the short side.
Where to set your stop-loss for a Gartley trade?
It is always recommended that you use a stop loss order regardless of your preferred entry signal. By doing this, you will be protecting yourself from any rapid or unexpected price moves. The stop loss order of a bullish Gartley trade should be found below the D point of the chart pattern. But for a bearish Gartley trade, your stop loss order should be found above the pattern’s D point.
What to aim for your take profit for a Gartley trade?
When you open your Gartley trade and you place your stop loss order, you expect the price to move in your favor, right? And if and when it does, you should know how long you expect to stay in the trade.
It is advisable to enter a full position after the D bounce and then scale out at different levels when trading a Gartley harmonic pattern. If the price momentum continues to show signs of strength, you can opt to keep a small portion of the trade open so as you can catch a large move. Use price action clues such as trend lines, support and resistant techniques, candle patterns and trend lines to find the right final exit point. But generally, if the price action shows no signs of interrupting the new trend, just stay in it for as long as you can.
References
https://www.investopedia.com/terms/g/gartley.asp
https://patternswizard.com/gartley-harmonic-pattern/
https://learn.tradimo.com/advanced-chart-patterns/gartley-pattern
https://www.babypips.com/learn/forex/the-gartley-and-the-animals
https://forextraininggroup.com/trading-the-gartley-pattern-ratios-rules-and-best-practices/
https://algorush.com/trading-academy/advanced-lessons/harmonic-patterns/common-harmonic-patterns/gartley-pattern/
Start Harmonic Trading
Learn Harmonic Patterns
Recent Trading Guides
-
December 18, 2020
Harmonic Patterns Explained For Beginners
-
November 17, 2020
Trading Breakouts within Price Action & Multiple Indicators
-
October 28, 2020
Importing High Quality Tick Data on MetaTrader 4 & 5
Looking for User Guides?
Instructions for Algo Rush Expert Advisors, Indicators & Dashboards.
Trading Systems
-
From: $19.99 / month with 1 week free trial
Bat Pattern
What is the Bat harmonic pattern?
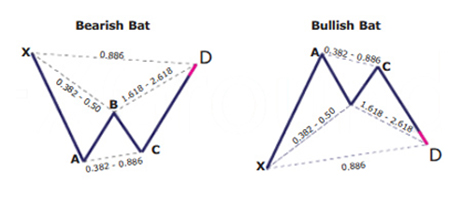
The Bat harmonic pattern is close to the Gartley pattern. It is a retracement and continuation pattern that comes up when a trend temporarily changes its direction but then continues on its original course. The pattern is a 5-point retracement structure that was discovered in 2001 by Scott Carney. It has particular Fibonacci measurements for every point within its structure. It is necessary to note that D is not a point, but rather a zone in which price is probably going to reverse. This zone is known as the Potential Reversal Zone (PRZ).
Key takeaways:
- The Bat harmonic pattern is a reversal pattern.
- It follows specific Fibonacci ratios (see below for more)
The B point retracement of the primary XA leg has to be lower than a 0.618, preferably a 0.50 or 0.382. The PRZ is made up of 3 converging harmonic levels:
- 0.886 retracement of the primary XA leg
- Extended AB=CD chart pattern, mostly 1.27 AB=CD
- Minimum BC projection is 1.618
The first target might be the 382 retracements of AD and the second target the 618 retracements of AD. A popular stop-loss level would be behind the X-point. Conservative traders may wait to get additional confirmation before trading. Bat patterns can be bearish and bullish.
How to identify the Bat harmonic pattern with Fibonacci
The bat harmonic pattern follows different Fibonacci ratios. One of the major ways to differentiate it from a Cypher pattern is the B point which, if it doesn’t go above the 50 percent Fibonacci retracement of the XA leg then it is a bat, otherwise it can turn into a cypher structure.
The market strategy of the pattern is suitable for all time frames and all markets types. Traders have to keep in mind that on lower time frames using the bat pattern market strategy has some challenges because the pattern tends to appear on less frequent on lower time frames.
The Bat pattern is a 4 legged pattern
As mentioned earlier, the bat harmonic pattern looks very similar to the Gartley pattern. It has four different legs marked as X-A, A-B, B-C, and C-D.
- X-A: In its bullish version, the first leg appears when the price sharply increases from point X to point A. This is the longest leg of the pattern.
- A-B: The A-B leg then sees the price switching direction and retracing 38.2 to 50 percent of the distance covered by the X-A leg. Have it in mind that the A-B leg can never retrace beyond point X. But if it does, the pattern is considered invalid.
- B-C: Here, the price changes direction for a second time and moves back up, retracing anything from 38.2 to 88.6 percent of the distance covered by the A-B leg. If it retraces up above the high of point A, the pattern is considered invalid.
- C-D: This is the last and most significant aspect of the pattern. As with the Gartley pattern, this is where the bat harmonic pattern ends and traders place their long (buy) trade at point D.
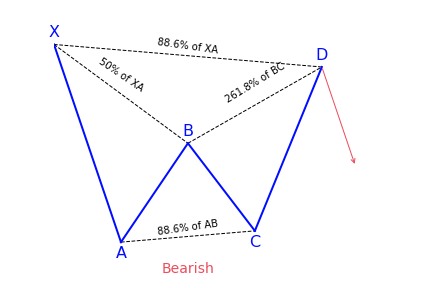
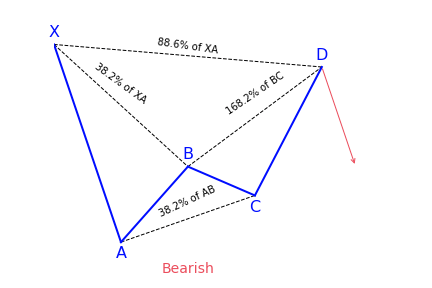
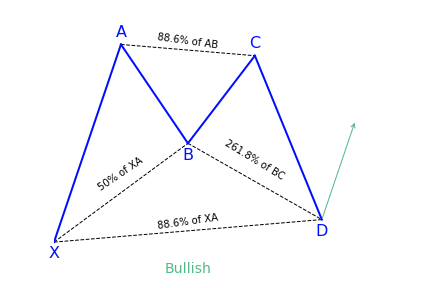
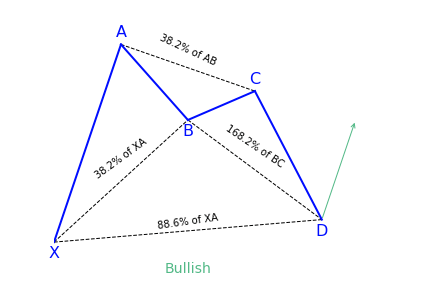
However, with the bat pattern, traders look to place their entry trade order at the location where the C-D leg has reached an 88.6 percent retracement of the X-A leg. Ideally, point D should also represent a 161.8 to 261.8 percent extension of the B-C leg.
What does the Bat pattern tell traders?
It offers traders the opportunity to enter the market at a good price, just as the pattern completes and the trend resumes. The main difference of the bat pattern to the Gartley pattern is where it completes – at an 88.6 percent Fibonacci retracement of the X-A leg. Its inner retracements are also slightly different.
The harmonic bat pattern teaches traders how to trade the bat pattern and begin earning money with a new exciting approach to technical analysis. The market strategy of the pattern is part of the harmonic trading patterns system of trading. Just as it is with many harmonic patterns, there is a bullish and a bearish version of the bat pattern.
How to trade when you see the Bat pattern?
Before trying and trading the pattern, confirm from this checklist that the pattern is real. It should include these vital elements:
- An AB=CD pattern or an extension of this pattern
- An 88.6 percent Fibonacci retracement of the X-A leg
- A 161.8 to 261.8 percent Fibonacci extension of the B-C leg
Next will be to look at how traders can trade using the bat pattern. We will make use of the bullish bat pattern as an example. For a bearish bat pattern, simply do the opposite for your orders.
The first thing to look for when looking for this pattern is the impulsive leg or the XA leg. We are trying to identify a strong move up or down depending if we either have a bullish bat or a bearish bat pattern.
The next thing that needs to be satisfied for an authentic bat pattern structure is a minimum 0.382 Fibonacci retracement of the XA leg and it can go as deep as 0.50 Fibonacci retracement of the XA leg, but it cannot break below the 0.618. This will form the B leg of the pattern.
The next thing traders should do is to look for a retracement of the AB leg up to at least 38.2 percent Fibonacci ratios, but it cannot exceed the 88.6 percent, and this will form the third point C of the pattern strategy.
The last thing to do is to establish is the D point, and to get to the D point, find the 0.886 Fibonacci ratios of the impulsive XA leg, which will lead to a deep CD leg, and finally, it will complete the entire structure of the pattern.
Market strategy with the Bat pattern
The market strategy of the pattern has been tested across various classes of assets (commodities, currencies, stocks, and cryptocurrencies). It is recommended that traders should take the time and back-test the bat harmonic patterns strategy before using this advanced pattern for trading.
Step 1: Drawing the pattern
- Begin by clicking on the bat pattern indicator that is found on the right-hand side toolbar
- Identify the beginning point X, which can be any swing high or low point on the chart
- After identifying the first swing high/low point, simply follow the market swing wave movements
- You should get 4 points or 4 swings high/low points that join and form the harmonic bat pattern strategy
Step 2: Trading the pattern
The 88.6 percent Fibonacci ratio provides traders a more reliable risk/reward ratio which is why the market strategy of the bat pattern is such a very popular as a market strategy. The best entry point is the 88.6 percent Fibonacci retracement which is a very accurate market turning point.
It is recommended that traders should enter as soon as they touch the 88.6 percent figure. Oftentimes the harmonic bat pattern strategy doesn’t go much above this level.
Step 3: Placing a stop-loss
Usually, traders should place their protective stop-loss lower than the point X of a harmonic bat pattern. That is the only logical location to hide the stop-loss because any break below will automatically invalidate the pattern.
Step 4: Take-profit margin
There can be several ways to manage your trades, but the best target for this pattern should be to use a multiple take profit formula. For this pattern strategy, take the first partial profit once you hit wave-C level and the remaining half once we break above wave-A.
By doing this you will accomplish two things:
- first, you’ll ensure that you accumulate profits,
- and secondly if the markets reverse, you ensure you’re stopped at BE and don’t lose any money.
References
https://forexop.com/harmonics/bat/
https://patternswizard.com/bat-harmonic-pattern/
https://www.profitf.com/articles/patterns/harmonic-pattern-bat/
https://www.investopedia.com/articles/forex/11/harmonic-patterns-in-the-currency-markets.asp
https://algorush.com/trading-academy/advanced-lessons/harmonic-patterns/common-harmonic-patterns/bat-pattern/
Start Harmonic Trading
Learn Harmonic Patterns
Recent Trading Guides
-
December 18, 2020
Harmonic Patterns Explained For Beginners
-
November 17, 2020
Trading Breakouts within Price Action & Multiple Indicators
-
October 28, 2020
Importing High Quality Tick Data on MetaTrader 4 & 5
Looking for User Guides?
Instructions for Algo Rush Expert Advisors, Indicators & Dashboards.
Trading Systems
-
From: $19.99 / month with 1 week free trial
Alternate Bat Pattern
What is the Alternate Bat harmonic pattern?
The alternate bat harmonic pattern is a variation of the Gartley pattern. Scott Carney developed it in 2003. It is popular for incorporating the 1.13XA retracement as the defining element in the Potential Reversal Zone (PRZ). The alternate bat harmonic pattern is one of the most precise trading patterns that works exceptionally great in the relative strength index (RSI) BAMM set up.

Key takeaways:
- The Alternate Bat pattern is popular for incorporating the 1.13XA retracement.
- Firstly, an important factor is the B point retracement that must be 0.382 retracements or it must be less of the XA leg.
- Furthermore, it only utilizes a 2 or more BC projections.
- The AB = CD pattern within the alternate bat pattern always extends requiring a 1.618 AB = CD calculations.
How to identify the Alternate Bat harmonic pattern?
The alternate bat is a unique trading pattern that involves certain precise measurements. Those measures are crucial in order to identify the alternate bat. A pattern must meet the following conditions to be an alternate bat pattern:
- The first important factor is the B point retracement that must be 0.382 retracements or it must be less of the XA leg.
- The alternate bat only utilizes 2.0 BC projections or greater than that.
- The AB = CD pattern within the alternate bat pattern always extends requiring a 1.618 AB = CD calculations.
- Generally, the best structures use 50% retracement at the midpoint.
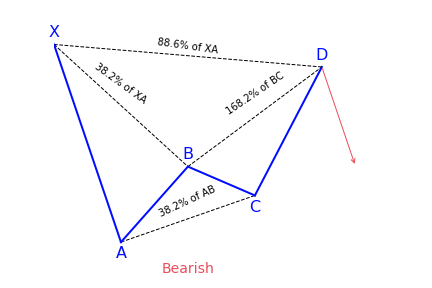
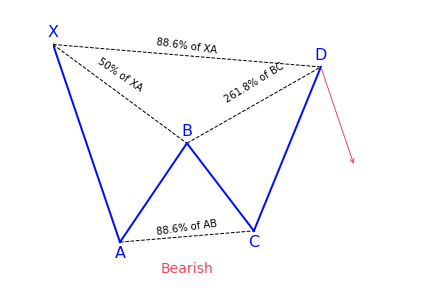
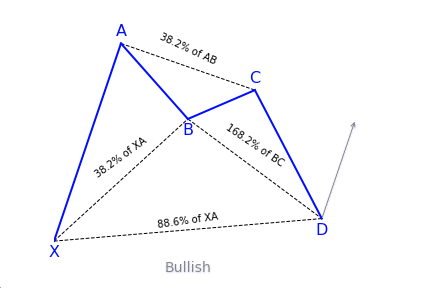
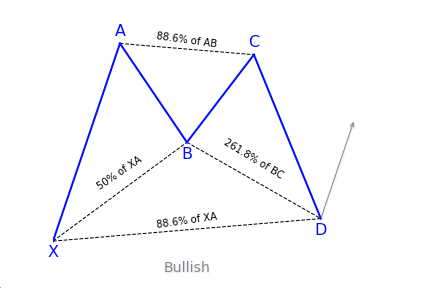
Resources
https://www.forex.academy/the-alternate-bat-pattern/
https://patternswizard.com/alternate-bat-harmonic-pattern/
https://harmonictrader.com/harmonic-patterns/alternate-bat-pattern/
https://algorush.com/trading-academy/advanced-lessons/harmonic-patterns/common-harmonic-patterns/alternate-bat-pattern/
Start Harmonic Trading
Learn Harmonic Patterns
Trading Systems
-
From: $19.99 / month with 1 week free trial
Crab Pattern
What is the Crab harmonic pattern?
The pattern was discovered in 2001. Just as it is with other harmonic patterns, this pattern is a reversal pattern. Therefore, we have the bearish crab pattern that indicates a bearish reversal in price and a bullish crab pattern that indicates a bullish reversal in price. Just as it is with other patterns, there’s a naming convention for every leg in the formation.
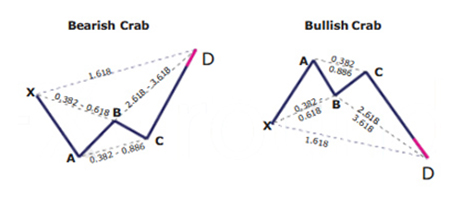
Key takeaways:
- The Crab harmonic pattern is a reversal pattern
- The Crab harmonic pattern is a 4 legged pattern
- The crab pattern follows strict Fibonacci ratios
Beginning with the swing low or high, every leg is marked by a letter. There are five swing points named as X, A, B, C and D. In some patterns, you will only find four (X, A, B and C).
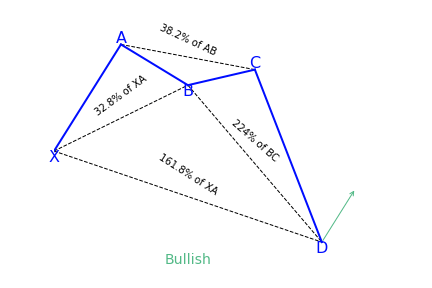
The crab pattern is different because of its sharp movement in the CD leg. This is usually a 1.618 percent Fibonacci retracement of the XA leg, the previous part of the crab pattern.
Some rules that have to be followed to confirm a crab pattern, such as:
- Following the XA leg in price, the point B is a retracement of between 38.2 to 61.8 percent. This retracement should ideally be lower than 61.8 percent
- The AB leg, is a counter trend move to the initial leg
- After point B, the next leg, BC, can run up to 38.2 to 88.6 percent Fibonacci ratios of the AB leg (C should never go beyond point A)
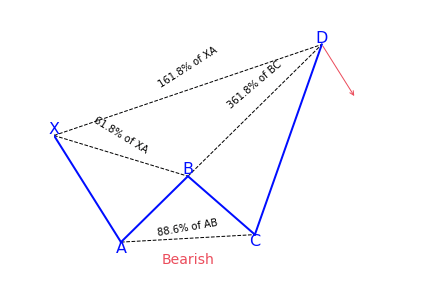
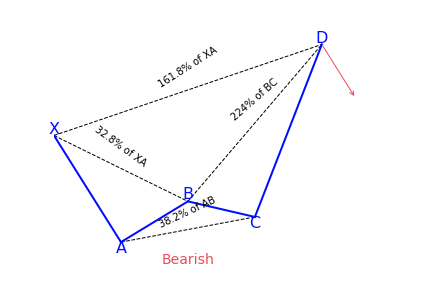
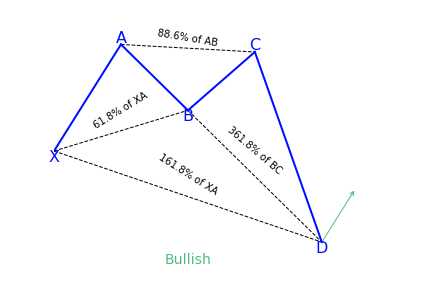
- Following the BC leg, price reverses once again, with the CD leg being the longest and reversing between 161.8 percent of the XA leg and an extreme 224.0 to 361.8 percent extension of the BC leg
When a Crab harmonic pattern is confirmed
After the crab pattern confirms these factors, a position can be taken after the CD leg is made. Even though you will not notice the CD leg is always reversing close to 161.8 percent, if price action starts to stall and such a reversal begins to happen, it can be a high probability trade setup.
It is always better to wait until point D is made and then take an appropriate short or long position. Stop-losses are placed at the low or the high of D, and targets are typically points A or B in the pattern.
How to identify the Crab pattern?
It can be hard to be familiar with the Fibonacci retracement and extension values in a crab pattern. Also, it can become tiring when using the Fibonacci tool to measure each leg while drawing the crab pattern.
Aside from the main rules of the crab pattern, traders can look for the following signs in the market, by analyzing the lows and highs and simply observing the price movement.
- BC leg mostly exists within the XA leg
- C is a higher low as opposed to A in a bearish crab pattern or C is the lower high as opposed to A in a bullish crab pattern
- B makes a lower high when compared to X in a bearish crab pattern, or B makes a higher low when compared to X in a bullish crab pattern
- D is the extreme, indicating a lower low or a higher high, going beyond X
What does the Crab harmonic pattern tell traders?
Just like the butterfly, it can help traders identify when a current price move is likely getting to its end. This means traders can enter the market just as the price changes direction in the opposite way.
The crab and deep crab represent important overbought and oversold conditions, and reaction after completion is mostly sharp and fast. It is the opinion of many analysts and traders that the crab pattern and deep crab represent some of the quickest and most profitable patterns out of all harmonic patterns.
Trading a bearish Crab pattern
To trade a bearish crab pattern, put a short (sell) order at point D (the 161.8 percent Fibonacci extension of the XA leg).
- Entry: Identify where the pattern will end at point D, and place your order
- Stop-Loss: Put your stop-loss just below point D
- Take Profit: The location of your profit target is highly subjective and depends on your objectives and market conditions. If you desire aggressive profit, place it at point A of the pattern. For a more conservative profit, place it at point B.
Trading a bullish Crab pattern
First of all, choose the crab pattern charting tool and follow all the above rules to identify the pattern. Remember that the Fibonacci ratios are very important to trade the crab pattern. If you notice the pattern on a price chart and if you find the ratios not matching with the pattern rules, it means that the pattern is not valid. So do not trade that pattern.
When the price action confirms the pattern, immediately enter for a buy. If you are a conservative trader, ensure you wait for a couple of bullish confirmation candles before entering the trade.
There are four targets (X, B, C, A) to place the take-profit order in the crab pattern. At the start, traders try to book full profit at point A, but when the price crosses point B, the market turns sideways. So book half of your profit at point B and then close your full positions at point A.
Most of the traders placing their stop-loss way below point D; however, that’s a wrong way to do it because they are risking more due to this simple logic. If the price action breaks point D, it automatically invalidates the pattern.
Crab pattern vs. Butterfly pattern
The two main things that differentiate the crab pattern from the butterfly pattern is that a butterfly pattern has a swing point D that ends at the 127.2 percent Fibonacci extension of the XA leg. Also, the butterfly pattern retraces to 78.6 percent of the previous XA leg.
But when you consider the crab pattern, the swing point D ends at the 161.8 percent extension of the XA leg and terminates the AB leg between 38.2 percent and 61.8 percent. These two major differences in the Fibonacci ratios between the crab pattern and the butterfly pattern make them unique from each other.
References
https://patternswizard.com/crab-harmonic-pattern/
https://www.forex.academy/the-deep-crab-pattern/
https://www.babypips.com/learn/forex/the-gartley-and-the-animals/
https://forextraininggroup.com/trade-crab-pattern-deep-crab-pattern/
https://algorush.com/trading-academy/advanced-lessons/harmonic-patterns/common-harmonic-patterns/crab-pattern/
Start Harmonic Trading
Learn Harmonic Patterns
Recent Trading Guides
-
December 18, 2020
Harmonic Patterns Explained For Beginners
-
November 17, 2020
Trading Breakouts within Price Action & Multiple Indicators
-
October 28, 2020
Importing High Quality Tick Data on MetaTrader 4 & 5
Looking for User Guides?
Instructions for Algo Rush Expert Advisors, Indicators & Dashboards.
Trading Systems
-
From: $19.99 / month with 1 week free trial
Deep Crab Pattern
What is the Deep Crab harmonic pattern?
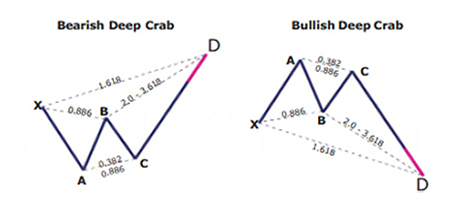
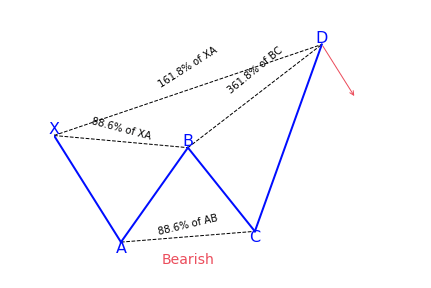
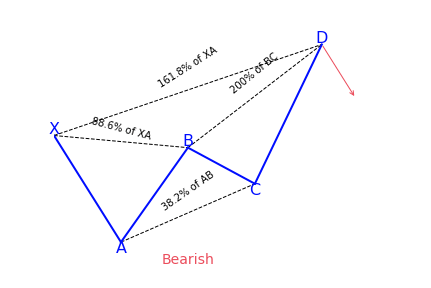
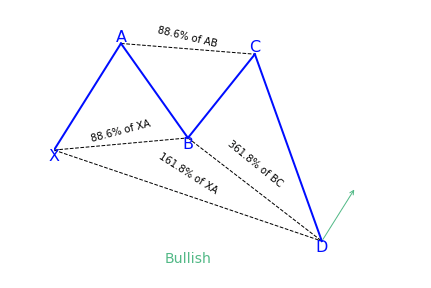
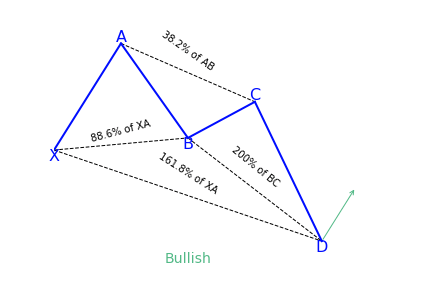
The deep crab is a variation of the normal crab pattern. It is still a 5-point extension, and it still has the endpoint, D, at the 161.8 percent extension of XA, but the little difference is in the AB=CD importance.
Key takeaways:
- The Crab & Deep Crab harmonic patterns are reversal patterns
- The crab pattern follows strict fibonacci ratios
- The deep crab pattern also follows Fibonacci ratios (but with a slight variation)
The most distinguishing component of this pattern is the importance of the particular 88.6 percent retracement point of B. Together with the crab pattern; the deep crab pattern presents an especially extended and long move towards D.
How to identify the Deep Crab pattern?
It can be hard to be familiar with the Fibonacci retracement and extension values in a crab pattern. Also, it can become tiring when using the Fibonacci tool to measure each leg while drawing the crab pattern.
Aside from the main rules of the crab pattern, traders can look for the following signs in the market, by analyzing the lows and highs and simply observing the price movement.
- BC leg mostly exists within the XA leg
- C is a higher low as opposed to A in a bearish crab pattern or C is the lower high as opposed to A in a bullish crab pattern
- B makes a lower high when compared to X in a bearish crab pattern, or B makes a higher low when compared to X in a bullish crab pattern
- D is the extreme, indicating a lower low or a higher high, going beyond X
What does the Deep Crab harmonic pattern tell traders?
Just like the butterfly, it can help traders identify when a current price move is likely getting to its end. This means traders can enter the market just as the price changes direction in the opposite way.
The crab and deep crab represent important overbought and oversold conditions, and reaction after completion is mostly sharp and fast. It is the opinion of many analysts and traders that the crab pattern and deep crab represent some of the quickest and most profitable patterns out of all harmonic patterns.
References
https://patternswizard.com/crab-harmonic-pattern/
https://www.forex.academy/the-deep-crab-pattern/
https://www.babypips.com/learn/forex/the-gartley-and-the-animals/
https://forextraininggroup.com/trade-crab-pattern-deep-crab-pattern/
https://algorush.com/trading-academy/advanced-lessons/harmonic-patterns/common-harmonic-patterns/deep-crab-pattern/
Start Harmonic Trading
Learn Harmonic Patterns
Recent Trading Guides
-
December 18, 2020
Harmonic Patterns Explained For Beginners
-
November 17, 2020
Trading Breakouts within Price Action & Multiple Indicators
-
October 28, 2020
Importing High Quality Tick Data on MetaTrader 4 & 5
Trading Systems
-
From: $19.99 / month with 1 week free trial
Butterfly Pattern
What is the Butterfly harmonic pattern?
The butterfly pattern is a reversal chart pattern that is in the category of harmonic patterns. It shows price consolidation and is mostly noticed at the end of an extended price move.
Traders can apply the butterfly pattern to determine the end of a trending move and position for the start of a correction or new trend phase. You will often see this pattern during the last wave of the impulse sequence in Elliott wave terms.
Key takeaways:
- The Butterfly pattern is a harmonic reversal pattern
- It follows specific fibonacci ratios (which you can see in the structure part below)
The harmonic butterfly pattern, like all other harmonic patterns, is a reversal trading pattern that can be universally traded all the time. Some people prefer to trade them on higher time frames. Some many different structures and variations can be seen as butterfly structures. The butterfly looks similar to the Gartley 222 harmonic pattern, but the main advantage is that traders can buy and sell at new lows or highs because wave D terminates beyond the starting point of wave XA.
The pattern was discovered by Bryce Gilmore and Larry Pesavento, and it usually forms close to the extreme lows and highs of the market and predicts a reversal.
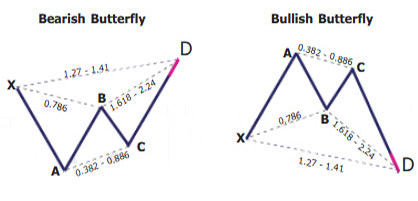
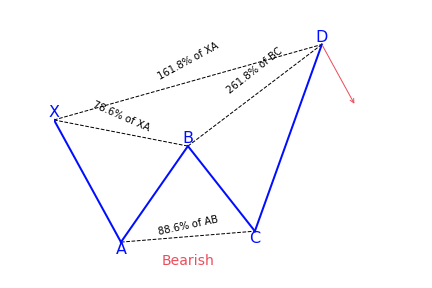
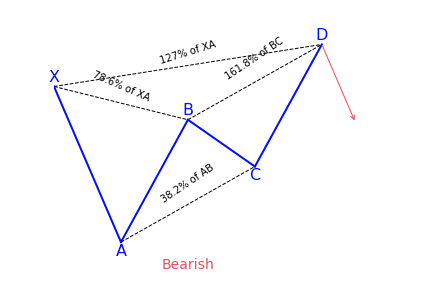
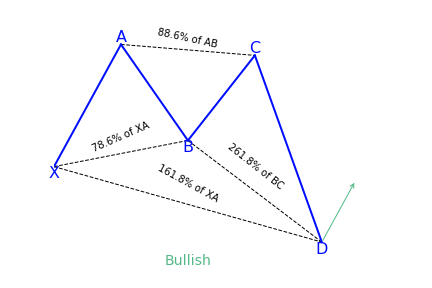
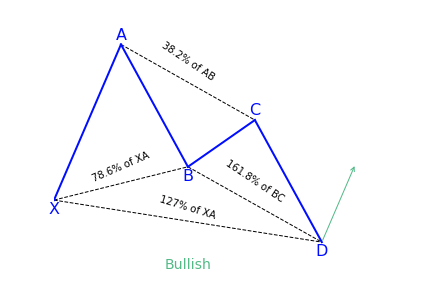
The butterfly pattern is made up of four legs marked X-A, A-B, B-C, and C-D. It helps traders determine when a current price move is probably getting to its end. This means traders can enter the market as the price changes direction.
How to identify the Butterfly pattern?
Just as mentioned earlier, the butterfly pattern resembles the bat and Gartley patterns, with four different legs labeled X-A, A-B, B-C, and C-D. The pattern tells traders when to sell after the pattern has completed.
X-A
In its bearish version, the first leg is formed when the price sharply falls from point X to A.
A-B
The A-B leg then notices the price switch direction and retraces 78.6 percent of the distance covered by the X-A axis.
B-C
In the B-C leg, the price changes direction for a second time and goes back down, retracing 38.2 to 88.6 percent of the distance covered by the A-B leg.
C-D
The C-D axis is the last and most significant part of this pattern. Just as it is with the Bat and Gartley patterns, you should also have an AB=CD structure to complete the butterfly pattern, but the C-D leg mostly extends to form a 127 or 161.8 percent extension of the A-B leg. Traders would be looking to enter at point D of the pattern.
A big variation with the butterfly pattern over the Bat or Gartley patterns is that traders look to place their trade entry order at the point where the C-D leg has reached a 127 percent Fibonacci extension of the X-A leg. It is the longest leg of the pattern. Generally, point D should also show a 161.8 to 261.8 percent extension of the B-C leg.
The pattern has four price swings, and its presence on the chart looks like the letter ‘M’ in downtrends, and ‘W’ in uptrends. During its formation, it can at times be mistaken for a double bottom or double top pattern.
What does the Butterfly pattern tell traders?
The Butterfly is one of the most important harmonic patterns due to its nature of where it shows up. Both Carney and Pesavento emphasized that this pattern shows the important highs and lows of a trend. In fact, by using various time frame analyses, it is common to see various butterfly patterns show up in different timeframes all at the end of a trend. The pattern is an example of an extension pattern and it generally forms when a Gartley pattern is invalidated by the CD wave going pass X.
There are two versions of this pattern that are bullish, in which traders are advised to buy, and bearish in which traders should sell. Precision is vital when it comes to applying the butterfly pattern because it allows traders to get rid of errors.
How to trade when you see the Butterfly harmonic pattern?
Before trading the butterfly harmonic pattern, confirm from the following checklist that the pattern is real. It should have the following vital elements:
- AB= an ideal target of 78.6 percent of XA leg
- BC= minimum 38.2 percent and maximum 88.6 percent Fibonacci retracement of AB leg
- CD= Is a target between 1.618 to 2.618 percent Fibonacci extension of AB leg between 1.272 to 1.618 of XA leg
Entry point
Determine the place where the pattern will complete at point D – this will be at the 127 percent extension of the X-A leg.
Stop-loss
Put a stop-loss just below the 161.8 percent Fibonacci extension of the X-A leg.
Take profit target
The location for placing a take-profit target with this pattern is very subjective and depends on your trading goals as well as the conditions of the market. To have an aggressive profit target, put it at point A of the pattern. For a more conservative profit target, put it at point B.
Trading a bearish butterfly harmonic pattern
Place the sell order at point D (a 127 percent extension of the XA leg). Position the stop-loss right above an extension of 161.8 percent of the XA leg. And place the profit target at A for an aggressive move at B for a defensive move.
Trading a bullish butterfly harmonic pattern
Determine the end of the pattern at point D, which is an extension of 127 percent of the XA leg. You need to put a buy order at this point. Now, below a Fibonacci extension of 161.8 percent of the XA leg, a stop-loss can be placed. Placing a profit target depends on both market conditions and your trading goals.
Comparisons to the Gartley pattern
The similarities of the butterfly and the Gartley pattern is in their construction — five points and four legs. But there are some vital differences, the most notable being that the butterfly is an extension pattern, not a retracement pattern, meaning that point D of the pattern goes beyond the starting point X. For a Gartley pattern, D represents a retracement back toward X, and not an extension beyond.
Also, statistics reveal that a butterfly pattern gives a higher chance of a successful trade than a Gartley pattern. Another thing to consider is that reversals after the completion of the butterfly are sharper as well.
Conclusion
It doesn’t matter if you are a beginner trader or a professional, you should not ever underestimate the efficiency of chart patterns as trading analysis tools. They are vital when it comes to indicating a reversal or continuation of the current trend and determining entry and exit positions. Butterfly patterns especially can be important in determining the end of price movements.
When effectively used, they can determine future price action with high accuracy. It makes them an important tool among traders in most markets including Forex, stocks, crypto, indices and more.
References
https://www.netpicks.com/butterfly-pattern/
https://fbs.com/analytics/guidebooks/butterfly-243
https://patternswizard.com/butterfly-harmonic-pattern/
https://www.babypips.com/learn/forex/the-gartley-and-the-animals
https://learn.tradimo.com/advanced-chart-patterns/butterfly-pattern/
https://algorush.com/trading-academy/advanced-lessons/harmonic-patterns/common-harmonic-patterns/butterfly-pattern/
Start Harmonic Trading
Learn Harmonic Patterns
Recent Trading Guides
-
December 18, 2020
Harmonic Patterns Explained For Beginners
-
November 17, 2020
Trading Breakouts within Price Action & Multiple Indicators
-
October 28, 2020
Importing High Quality Tick Data on MetaTrader 4 & 5
Looking for User Guides?
Instructions for Algo Rush Expert Advisors, Indicators & Dashboards.
Trading Systems
-
From: $19.99 / month with 1 week free trial
Shark Pattern
What is the Shark harmonic pattern?
The shark harmonic pattern shares some of the most unique conditions that can be found on some of the extreme patterns. For instance, both the shark pattern and the 5-0 are not typical M-shaped or W-shaped patterns. The shark pattern comes up before the 5-0 pattern. It also has a particular and specific Fibonacci level that the deep crab shares.
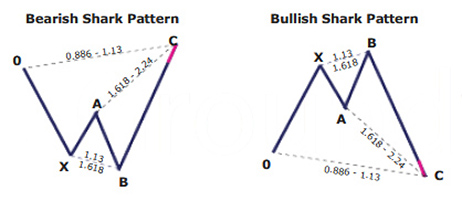
Key takeaways:
- The Shark pattern is a reversal harmonic pattern.
- It follows specific Fibonacci ratios (which you can see in the structure section)
One character that might seem abnormal to all other harmonic patterns is that the reaction to the completion of this pattern is short-lived. This is one of the most useful harmonic setups in the entire work of the creator of the pattern, especially for intraday traders, and this pattern is very much for active traders.
This pattern is similar to the bat pattern, except for the C point going beyond the BC leg. It can point to a good counter-trend move. The potential reversal zone (PRZ) is defined by these harmonic levels: the 88.6 percent retracement of the initial leg and the 1.13 reciprocal ratio of the previous leg. Targets can be various retracements of the CD leg, all the way up to C leg. There are various means of determining where the stop should go. Some put it above the next structure level after the D point, others select the 1.41 extension of XA.
The Shark pattern frames a trade
Conservative traders look to find more confirmation before going into a trade. It can be based on the value of an indicator, a particular bar pointing at a reversal or confluence with other processes. The shark pattern can be either bearish or bullish. It is as effective as other harmonic patterns and a common variation on trading the pattern is to trade the last leg to completion.
A bearish shark mostly shows entry and exit points. Most real-time samples will not have very accurate ratios between OXABC. Another interesting aspect of the shark pattern is its volatility, which makes it look like the crab pattern. In a bearish state, shark patterns mostly have a long series of candle bodies and long spikes, created very close to the PRZ level of C. On the other hand, a bullish shark pattern shows the volatility created close the PRZ zone of D.
How to identify the Shark pattern?
The structure of a shark pattern has an impulse leg (X-A) and a retracement leg (B). In this case, the retracement has no particular value. The continuation leg (C) has to get to a Fibonacci extension of 113 percent of the B-A leg, but shouldn’t go beyond the 161.8 percent mark, a retracement for X-C follows afterward.
The shark pattern so obtained has to get to an extension of 88.6 percent of this retracement, but should not be more than 113 percent. The next Fibonacci extension will be B-C, which is an extension of the A-X leg, within the 161.8 to 224 percent range. But as far as entering a trade goes, it is different from other harmonic patterns, for example:
- The entry point should be at an extension of 88.6 percent of the O-X leg, and the stops will follow up at point C
- Targets can be at 61.8 percent of the B-C leg
- It is not difficult finding the zone to enter trades. This is the area where the X-C Fibonacci retracement and the B-C Fibonacci extension overlap
The main factor that differentiates between the harmonic shark and other patterns is that it depends on the 88.6 percent and the 113 percent reciprocal ratios. Once the price point at D is created, prices decline or rally very quickly. Therefore it needs active management of the trade. In other words, you simply cannot set up the harmonic shark pattern and come back a while later to trade it. By that time price would have gone a major distance.
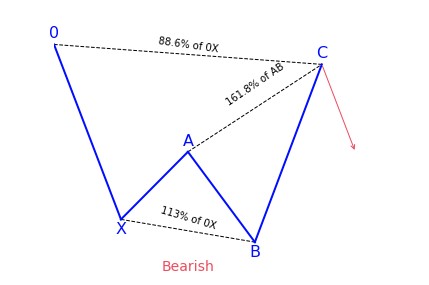
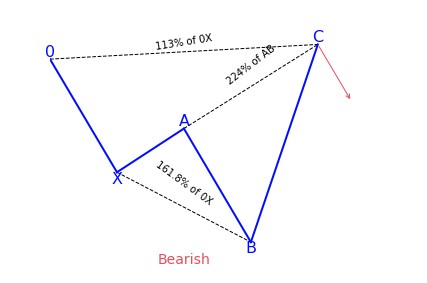
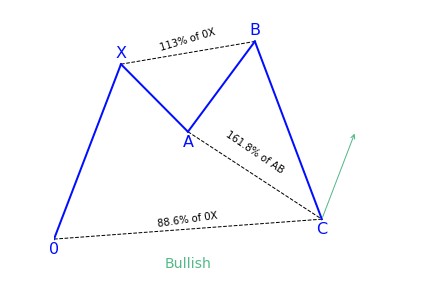
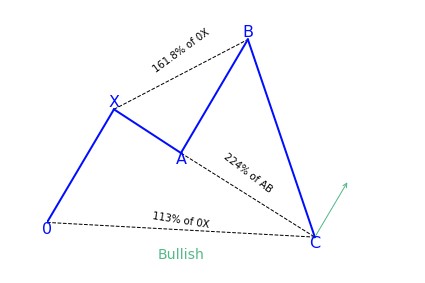
What does the Shark pattern tell traders?
Just like any other harmonic pattern, the shark trading strategy is a five-leg reversal pattern. It follows particular Fibonacci ratios.
The pattern differentiates itself from the other harmonic patterns by its five points setup being labeled as O, X, A, B, C. Additionally, the termination point of leg B ends above wave X. It goes beyond a minimum of 1.13 and a maximum of 1.618 Fibonacci ratios.
A real shark pattern should fulfill these three Fibonacci rules:
- AB= retraces between 1.13 to 1.618 Fibonacci extension of XA leg
- BC= extends to 113 percent Fibonacci extension of 0X leg
- CD= Poses a target of 50 percent Fibonacci Retracement of BC leg
The shark harmonic pattern is within the 5-0 pattern structure. The structure means that, unlike the other harmonic patterns, all trades have to be taken based on point C. While the point D is used as a pre-defined profit target. Generally, the completion point of the CD swing-leg ends at 50 percent Fibonacci retracement of BC leg. It has to also satisfy the AB=CD condition.
This is the most common way the pattern is traded by attempting to grab the final move of a complex pattern entering at C. It also has a protective stop loss above or below the 2.24 of AB retracement and targeting the 50 percent retracement of the BC swing-leg.
How to trade when you see the Shark pattern?
The ideal method used to trade a shark pattern is quite different from that used for other chart patterns. The take profit can be at 50 to 61.8 percent of BC.
The way to trade this pattern is to go in at the open of the next candlestick after the harmonic indicator has detected the pattern. As soon as the C-leg forms, enter the market with a protective stop-loss at the 2.618 extensions of AB swing-leg.
Charting and drawing the Shark pattern
- Click on the indicator of the harmonic pattern which can be found on the right-hand side toolbar of the platform
- Determine on the chart the starting point 0, which can be any swing high or low point on the chart
- After locating the first swing high/low point, follow the market swing wave movements
Traders need to have 4 points or 4 swings high/low points that join together to form the harmonic crab pattern strategy. Each swing leg has to be validated and stick to the Fibonacci ratios of the shark pattern forex.
Trading the Shark pattern
Buy at point D, which has to satisfy the requirement CD = 1.13 OX segment. The D to X can be found anywhere between 0.886 to 1.13, but it is best to take trades using an ideal 1.13 extension.
Stop-loss on the Shark pattern
The stop-loss can be placed below the 1.150 Fibonacci extensions of XA at point C. As the market begins to go towards the first take profit, move it after D leg. This is the best place to hide the stop-loss because any break below will automatically invalidate the Fibonacci requirements for a shark pattern.
Just as it is with any new pattern, you need to be cautious when trading this pattern. You should only trade the best price structure that fits into all the Fibonacci ratios with great precision. Be picky! The shark harmonic trading strategy works very well as a strong counter-trend strategy.
References
https://fbs.com/analytics/guidebooks/shark-244
https://patternswizard.com/shark-harmonic-pattern/
https://www.tradingview.com/education/sharkpattern/
https://harmonictrader.com/harmonic-patterns/shark-pattern/
https://tradingstrategyguides.com/shark-harmonic-trading-strategy/
https://algorush.com/trading-academy/advanced-lessons/harmonic-patterns/common-harmonic-patterns/shark-pattern/
Start Harmonic Trading
Learn Harmonic Patterns
Recent Trading Guides
-
December 18, 2020
Harmonic Patterns Explained For Beginners
-
November 17, 2020
Trading Breakouts within Price Action & Multiple Indicators
-
October 28, 2020
Importing High Quality Tick Data on MetaTrader 4 & 5
Looking for User Guides?
Instructions for Algo Rush Expert Advisors, Indicators & Dashboards.
Trading Systems
-
From: $19.99 / month with 1 week free trial
Cypher Pattern
What is the Cypher harmonic pattern?
The cypher pattern trading strategy teaches traders how to correctly trade and draw the cypher pattern. The cypher harmonic pattern can be used on its own and provide traders a profitable forex trading strategy. It is not surprising that geometric patterns are used in forex charts. And the cypher harmonic pattern is a very good representation of that. The pattern is part of the harmonic trading patterns and is the most exciting harmonic pattern because it has the highest winning rate.

This is one of the few patterns not identified by Scott Carney. It was discovered by Darren Oglesbee, and though it is technically an advanced pattern formation, it is often linked with and traded together with harmonic patterns. It has particular Fibonacci measurements for every point within its structure.
Key takeaways:
- The Cypher harmonic pattern is a reversal pattern
- As other XABCD patterns, it has 4 legs
- It follows strict fibonacci ratios
What is the Cypher pattern?
The cypher pattern is an advanced harmonic pattern that, when traded correctly, can have a truly outstanding strike-rate as well as a pretty good average reward-to-risk ratio.
The cypher is a five-point pattern, composed of points XABCD. It is easy to spot on a chart due to its characteristic wave-like look, displaying either rising peaks or falling valleys. Traders can trade it like other harmonic patterns, by waiting for a reversal at the end and then using pending orders to profit from any potential breakout.
This pattern looks like the butterfly in both its construction and where it will occur (close to the end of trends). However, the cypher pattern is rare and not one that shows up frequently. But don’t confuse rarity with being more powerful or profitable.
It is known to have a high positive expectancy, no different than a bat or alternative bat. Just like all other harmonic patterns, the Cypher has specific rules and conditions that must be met for it to be a particular cypher pattern.
How to identify the Cypher pattern?
The pattern must verify a few conditions to confirm:
- B has to retrace to an expansive range between 38.2 and 61.8 percent of XA, at least 38.2 percent, but not exceeding 61.8 percent.
- C is an extension leg and goes beyond A – but must move to at least 127.2 percent, but it is normal for it to go as far as the 113 to 141.4 percent. It is considered invalid if it moves beyond the 141.4 percent.
- CD leg should break the 78.6 percent level of XC.
- The PRZ (potential reversal zone) of D is a wide range where the price has to get to. Price can move anywhere between 38.2 to 61.8 percent.
Cypher has less rules to follow compared to other harmonic patterns. Although its successful rate has nothing special compared to Gartley or Bat, the frequency of showing up and the ease of rules make this pattern become the favorite for all beginner traders. This pattern works best when the market is calm. In a strong trending market, especially after the news, the cypher pattern becomes less reliable. The bigger the pattern (the longer it takes to form the pattern), the stronger the support/resistance it gives.
The B rule & What does the Cypher pattern tell traders?
Even though not many people apply it, it is an important rule. The rule basically states that B cannot touch the 78.6 percent retracement of X to C, including the candlestick wicks.
Bullish and Bearish Cypher Patterns
In any cypher, points X, C and D are the most important points. For a bullish cypher pattern, X should be the pattern low and C the pattern high. A bearish cypher pattern makes its high at X and its low at C.
In the bullish cypher pattern, the points A and C has to make successively higher highs and point D has to be above X. In the bearish cypher points A and C have make successively lower lows and point D should be below X.
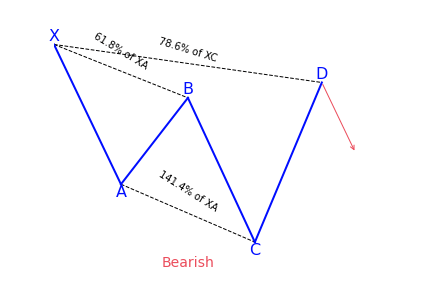
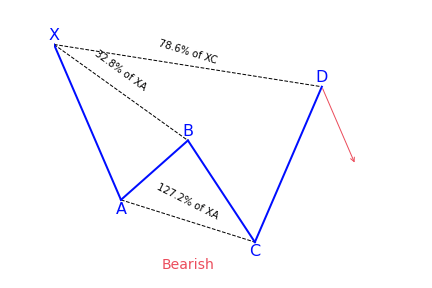
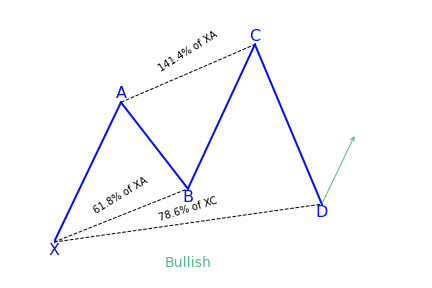
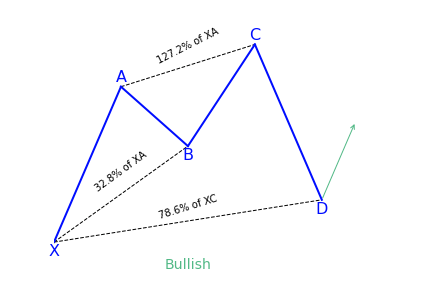
Market Psychology & the Cypher harmonic pattern
The cypher is a technical wave pattern in which the market is trending but it makes sharp reversals during the day. The important point of the bullish cypher is that both the lows and the highs are trending upwards. For the bearish pattern, the opposite happens.
If the cypher completes successfully with a reversal taking place at point D, it may eventually become a trend channel where the price moves between the highs and lows. Cyphers can also appear inside price channels that are already formed.
How to trade when you see the Cypher pattern?
While trading the cypher pattern, you will apply a set of simple rules. They will try to minimize risk and maximize profits. Even though there is one more important step to learn before defining the cypher pattern trading strategy rules.
Step 1: Drawing Cypher patterns
- Identify the starting point, X, on the chart, which can be any swing low or high point.
- Once you’ve located your first swing high/low point, follow the market swing wave movements.
- Every swing leg has to be validated and abide by the cypher pattern forex Fibonacci ratios.
Step 2: Trading process
Now that you know how to identify and qualify the harmonic cypher pattern, it’s time to trade the pattern. Standard methods of trading the cypher pattern include:
Entry point
The cypher pattern may be the most exciting harmonic pattern for risk management, because it has the highest winning rate. Backtesting results have continuously proven the cypher pattern forex is a very dependable harmonic pattern.
Next, buy with a market order at the first candle preceding the completion of the D point at 0.786 Fibonacci retracement of the XC leg. Once the market touches the 0.786 level, wave D is in place, because you can’t control how far the market will go.
When the CD leg gets to the 78.6 percent retracement level, the cypher pattern is complete and valid. However, the 78.6 percent Fibonacci retracement level of X to C also acts as the standard entry point for a valid cypher pattern trade.
Take profit
There are some ways to take profit with this pattern, but the standard method is to scale out of your position at the first take profit level and end the trade at the second take profit level. Take profit once you get to point A. To get to such levels, draw a Fibonacci retracement of the CD leg.
The cypher patterns trading method is a reversal method. Make sure you capture as much as possible from the new trend. If you’re not a fan of reversal strategy, and you prefer a trend following strategy, follow the MACD trend following strategy-simple to learn another strategy. The strategy has attracted a lot of interest from the Forex trading community.
Ensure you take profits once you reach point A of the pattern, because it has conservative take profit target.
So, why should you take profit so early?
For the most part of the harmonic patterns, it’s best to lock in profits as soon as possible. Since the cypher pattern is one of the most profitable harmonic patterns, you can give it more room for the price action to breath. You have the chance to at least see a retest of the wave A.
Stop-loss
Ensure you give your trade at least 10 pips space above X in the intraday charts. While trading a bullish cypher pattern, place the stop-loss at least 10 pips lower than the low of X. For a bearish pattern, place the stop-loss at least 10 pips higher than the high of X. That’s the only logical place to hide your stop-loss, because any break below will automatically invalidate the trade.
References
https://forexop.com/harmonics/cypher/
https://patternswizard.com/cypher-harmonic-pattern/
https://www.profitf.com/articles/patterns/forex-cypher-pattern/
https://forextraininggroup.com/harmonic-cypher-pattern-trade-setup/
https://tradingstrategyguides.com/best-cypher-patterns-trading-strategy/
https://algorush.com/trading-academy/advanced-lessons/harmonic-patterns/common-harmonic-patterns/cypher-pattern/
Start Harmonic Trading
Learn Harmonic Patterns
Recent Trading Guides
-
December 18, 2020
Harmonic Patterns Explained For Beginners
-
November 17, 2020
Trading Breakouts within Price Action & Multiple Indicators
-
October 28, 2020
Importing High Quality Tick Data on MetaTrader 4 & 5
Looking for User Guides?
Instructions for Algo Rush Expert Advisors, Indicators & Dashboards.
Trading Systems
-
From: $19.99 / month with 1 week free trial
Three Drive Pattern
What is the Three Drive (Three Drives) harmonic pattern?
The 3-drive chart pattern is a reversal pattern that is made up of two corrections and three legs, called drives. Traders often refer to it as an ancestor of the Elliott wave pattern, which makes use of a complex series of drives or waves to predict long-term price actions.
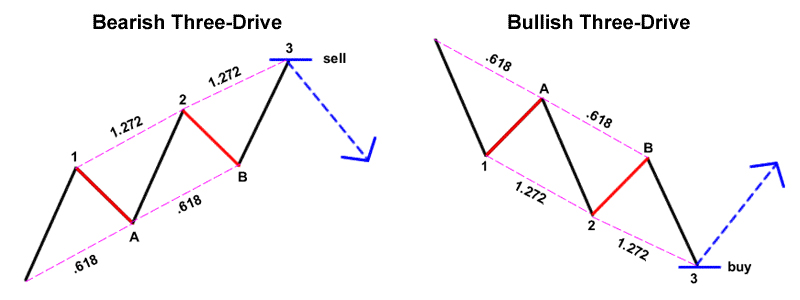
Key takeaways:
- The Three Drives pattern is a harmonic reversal pattern.
- It follows specific Fibonacci levels (which you can read more below)
The three drives pattern is self-sufficient, having different entry and exit points. It is a reversal pattern that is made up of three swings of the same length in the same direction. They correspond to particular Fibonacci ratios to identify potential reversal zones. The pattern can be both bearish and bullish and once discovered, it can be a precursor to strong market turns.
The three drives pattern is a reversal pattern that is made up of various higher highs or lower lows. They complete at a 127 or 161.8 percent Fibonacci extension. It can indicate that the market is exhausted in its recent move and a reversal will probably occur on the price chart. The bullish version of the pattern can help to determine possible buy opportunities and the bearish version can help to determine possible opportunities to sell.
The three drives pattern was first stated by Robert Prechter. It is not often used in trading because it is difficult to discover and less common than other forms of harmonic patterns. It is made up of symmetrical price movements with similar Fibonacci projections in a 5-wave structure.
Bearish Three Drives pattern
This pattern begins with the first drive which is a bullish move. Then a lower retracement to give the A point, which should complete into the 6.18 to 78.6 percent retracement of the first drive. From here another move higher will draw, providing the second leg which completes into the 1.27 percent extension of the first drive.
From here, a second retracement lower which should complete into 61.8 to 78.6 percent retracement of the second drive will appear, to give the B point. Lastly, we want to see one final push higher, giving us our third wave, which should complete into the 1.27 percent extension of the second drive, providing the third drive and the level which traders can look to sell.
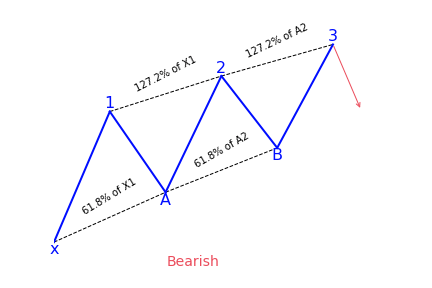
Bullish Three Drives pattern
The pattern begins with a bearish swing to give traders their first drive. Traders can then notice a retracement higher into the 61.8 percent level of the first drive to give traders the A point. From here, the price turns lower again to give the second drive which should complete into the 1.27 percent extension of the first drive.
From here, the price correct higher once more. It goes back up into the 61.8 percent retracement of the second drive to give us our B point.
Then there will be one final push lower with price trading down to the 1.27 percent extension of the second drive to give a third drive that completes the pattern and offers a buying zone.
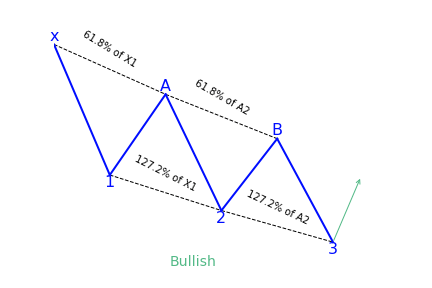
How to identify the Three Drives pattern?
The three drives harmonic pattern is identified by various three higher highs or lower lows. They gather in a reversal of the existing trend. Every move lower or higher is quantified by using the Fibonacci extension and retracement levels of 61.8 and 127.2 percent.
The below rules can help traders identify the pattern:
- Correction A has to be a 61.8 percent retracement of drive 1.
- Correction B has to be a 61.8 percent retracement of drive 2.
- Drive 2 has to be a 1.272 extension of correction A.
- Drive 3 has to be a 1.272 extension of correction B.
In some instances, the definition of the 3-drive pattern may be expanded to include various Fibonacci retracement or extension levels, like a 161.8 percent extension rather than a 127.2 percent extension. The pattern also works without Fibonacci levels, but it may be less accurate.
Traders also need to look at the volume behind every drive higher or lower. If the volume during drives is higher than during corrections, traders can have more confidence in an eventual trend change and capitulation after the last drive. Psychologically, the three drives pattern indicates three last attempts at driving the price lower or higher before capitulation happens and the trend reverses.
What does the Three Drives harmonic pattern tell traders?
The pattern is defined by three unique, consecutive and symmetrical drives to a top or bottom. Symmetry in both time and price is vital. It is critical to not force the pattern on the chart. If you don’t notice it, it is best not to trade it.
A reversal will probably happen when the third drive completes. Conservative traders observe for more confirmation that price is reversing. Traders can set their targets at their discretion, but normally goes beyond the last retracement.
If the pattern doesn’t show up, this could point to a strong continuation in the previously dominant movement. The three drives pattern can either be bearish or bullish.
How to trade when you see the pattern?
To trade the 3-drive pattern effectively, traders look to taking a position in the market on the third drive. This provides the most accurate price levels of where to enter the trade. It also gives the best potential to have a profitable trade.
The third drive mostly advances to a Fibonacci extension of 127.2 percent of the drive C. Some traders prefer to place their take-profit levels to the 161.8 percent of drive C. This is mainly a matter of personal preference and traders can set the levels to their choice as long as it provides a good risk to reward ratios set up.
Traders can apply the pattern in various ways, such as:
- To position a pending sell or buy order at the last 127.2 percent level, while keeping the stop-loss a few pips below or above the current swing low or high.
- Wait for the market to show a rejection of the price close to the third drive. This involves observing the candlestick patterns that show price rejection such as pin bars or dojis. These rejection bars can be differentiated based on the lower wicks or long upper. After the rejection bars form, traders can then put their entry and stop-loss points at the high and the low of the bars.
- Lastly, traders can also wait for the price to break through the 127.2 percent level. They can put a pending order when the price falls lower than this high or low. Applying the previously formed swing point low or high, the stops are then based accordingly.
It announces a potential reversal
The three drive chart pattern is a reversal pattern that comes out of the current trend. Therefore, it makes it possible for traders to profit from the trend change. The pattern can also indicate traders who are positioned in the trend to exist once the pattern comes up.
To effectively trade the three drives harmonic pattern, use the Fibonacci retracement and extensions to qualify the pattern. But this pattern does not occur very often, so traders need to only keep an eye out for it rather than put their entire trading on just the three drives pattern. With time, traders can form their trading processes to view the reversal of the price following the three drives pattern.
References
https://learn.tradimo.com/advanced-chart-patterns/three-drives
https://www.tradingheroes.com/three-drives-pattern-explained/
https://www.perfecttrendsystem.com/blog_mt4/en/three-drives-pattern
https://algorush.com/trading-academy/advanced-lessons/harmonic-patterns/common-harmonic-patterns/three-drive-pattern/
Start Harmonic Trading
Learn Harmonic Patterns
Recent Trading Guides
-
December 18, 2020
Harmonic Patterns Explained For Beginners
-
November 17, 2020
Trading Breakouts within Price Action & Multiple Indicators
-
October 28, 2020
Importing High Quality Tick Data on MetaTrader 4 & 5
Looking for User Guides?
Instructions for Algo Rush Expert Advisors, Indicators & Dashboards.
Trading Systems
-
From: $19.99 / month with 1 week free trial
- Dashboard MT4
- Dashboard MT5
- EA for MetaTrader 4
- EA for MetaTrader 5
- EA for MT4
- EA for MT5
- Expert Advisors for MetaTrader 4
- Expert Advisors for MetaTrader 5
- Expert Advisors for MT4
- Expert Advisors for MT5
- Indicator for MetaTrader 4
- Indicator for MetaTrader 5
- Indicator for MT4
- Indicator for MT5
- Indicators for MetaTrader 4
- Indicators for MetaTrader 5
- Indicators for MT4
- Indicators for MT5
- MetaTrader 4 Dashboard
- MetaTrader 4 EA
- MetaTrader 4 Expert Advisors
- MetaTrader 4 Indicator
- MetaTrader 4 Indicators
- MetaTrader 5 Dashboard
- MetaTrader 5 EA
- MetaTrader 5 Expert Advisors
- MetaTrader 5 Indicator
- MetaTrader 5 Indicators
- MT4 Dashboard
- MT4 EA
- MT4 Expert Advisors
- MT4 Indicator
- MT4 Indicators
- MT5 Dashboard
- MT5 EA
- MT5 Expert Advisors
- MT5 Indicator
- MT5 Indicators
- Scanner Dashboard MetaTrader
- Trading Indicator
- Tradingview Indicator
