Harmonic Patterns System
Harmonic price patterns are those that take geometric price patterns to the next level by utilizing Fibonacci numbers to define precise turning points. Unlike other more common trading methods, harmonic trading attempts to predict future movements.
System Overview
Great for harmonic traders and harmonic pattern enthusiasts, currently available for MetaTrader 5 and will be released for MetaTrader 4 in the near future. Our harmonic pattern trading setup is a non-lagging, non-repainting indicator and Expert Advisor.
Potential Reversal Zones
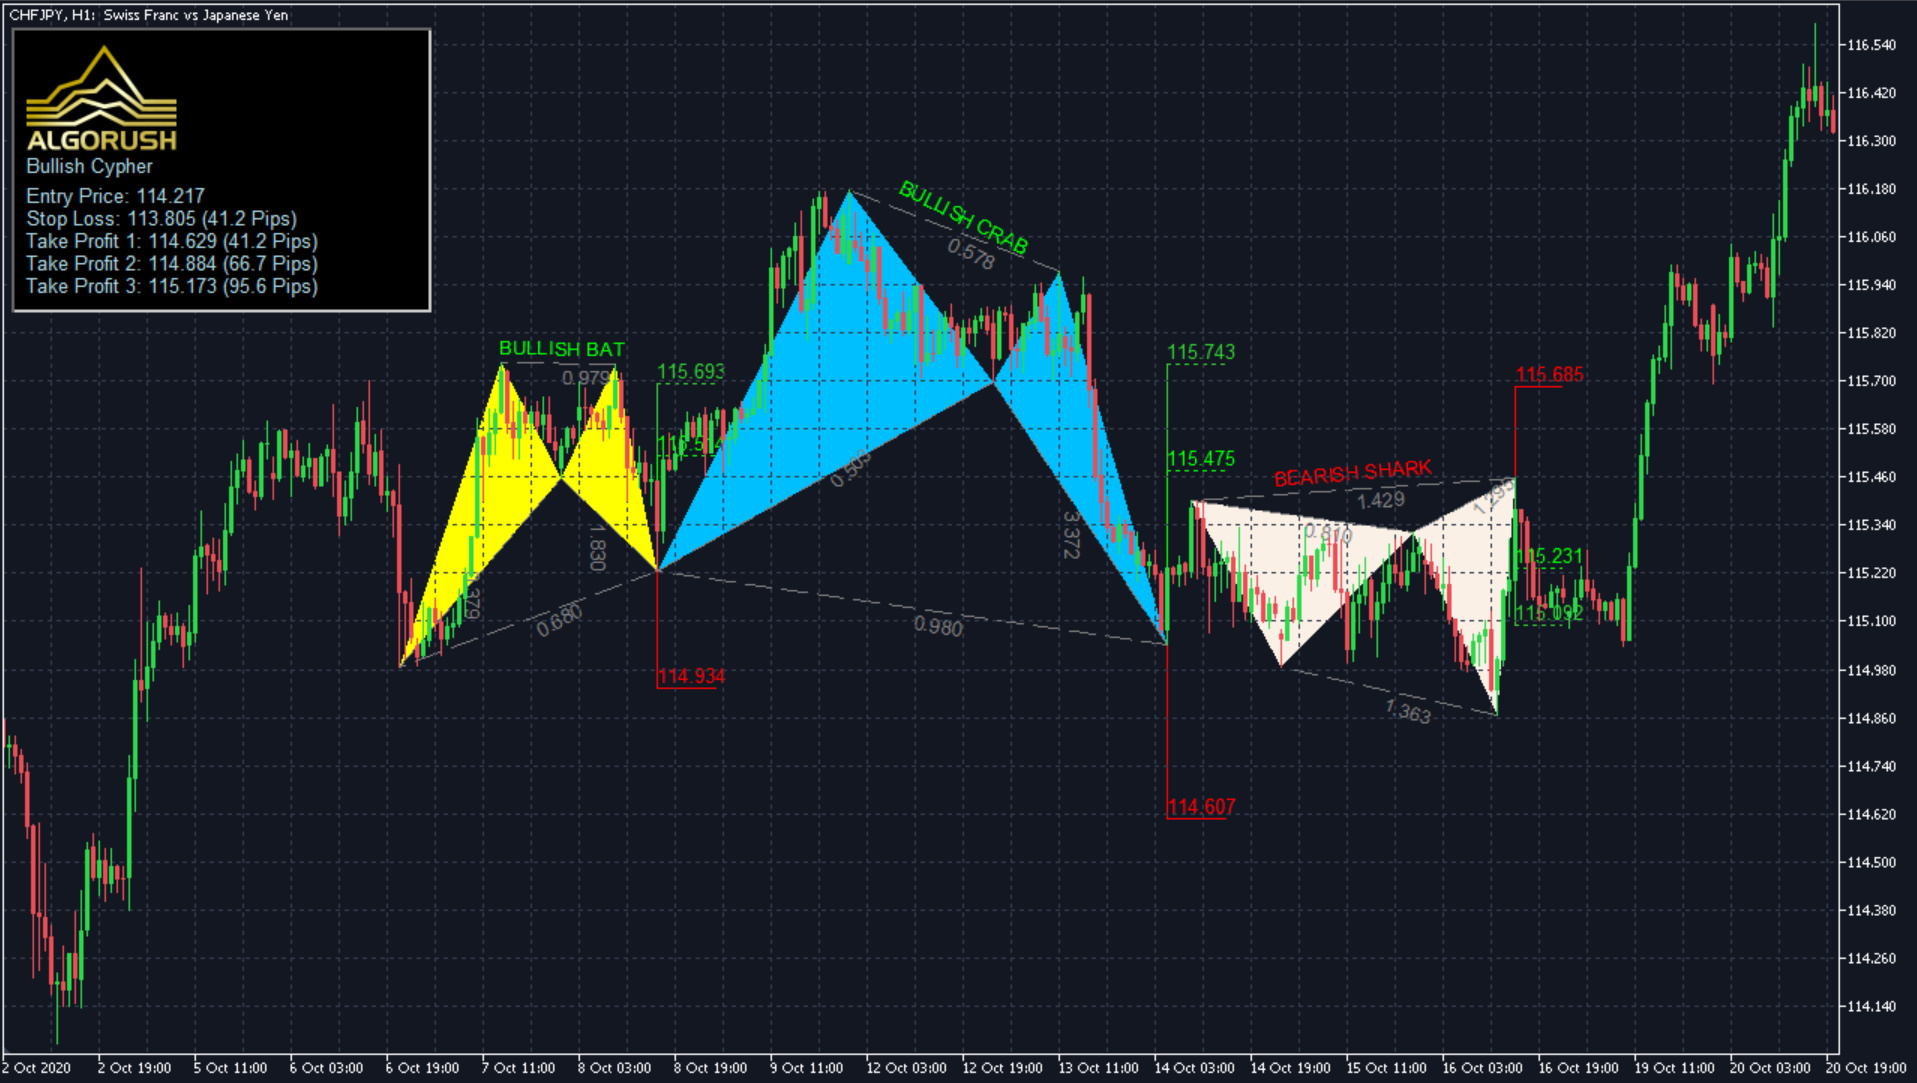
All harmonic patterns generated within our system comes in the form of projected D-Legs making the potential position prepare in advance before the pattern shape's full completion (minimum completion parameter is adjustable). Notifications as well as automated trades can now be determined by price action at this zone and take trades upon confirmations of proper reversal. Manually identifying and charting a valid harmonic pattern is difficult and time consuming, hence why we strongly recommend our Harmonic Patterns system.
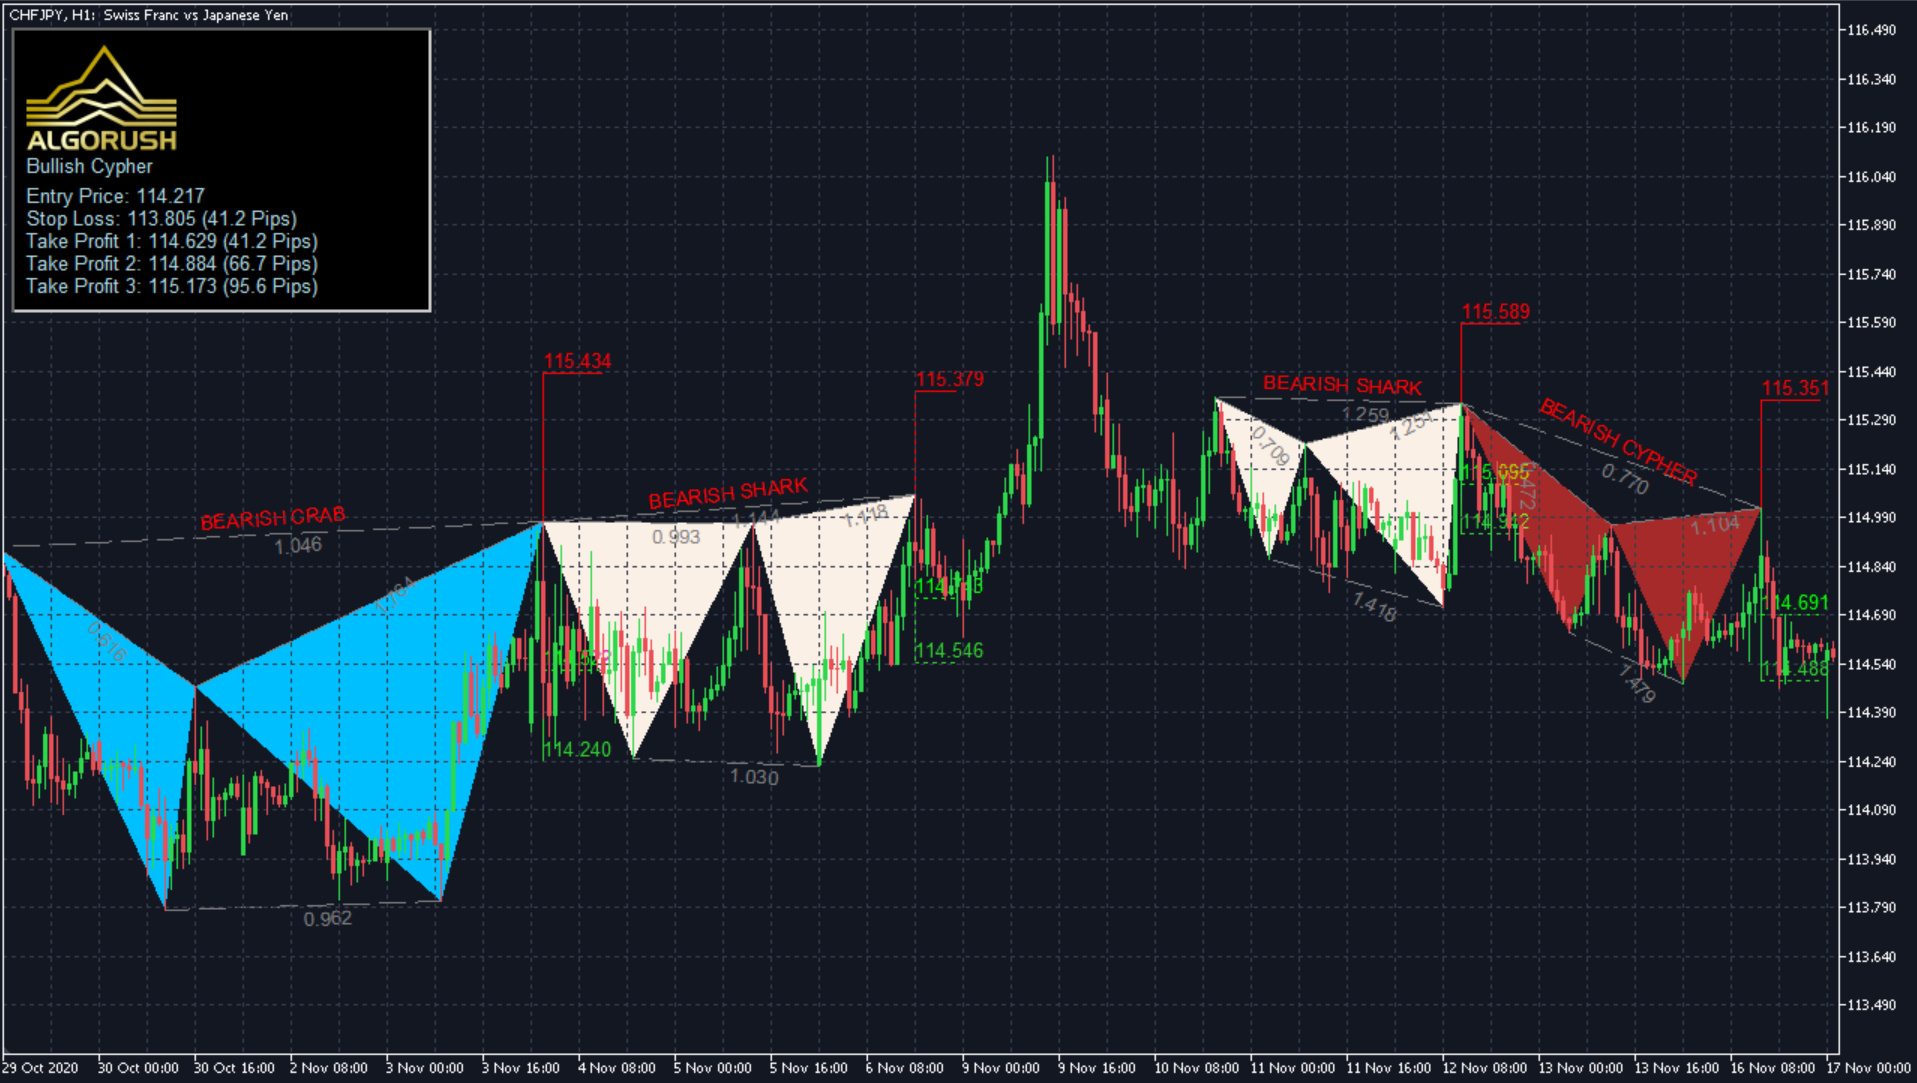
This trading tool gives you precise entry points called Price Potential Reversal Zone (PricePRZ), the invalidation zones (Stop Loss), as well as 3 exit points (Target Levels) ensuring adequate compensation for risk taken when held to maturity with average risk reward ratio of 3.12 for the 3 Target Levels.
It gives you notifications immediately a potential price divergence and possible reversal is detected. All you then need to do is watch out for price action at the PRZ price levels and take your trade (or let the EA do it for you) upon confirmations of proper reversal.
- Displays projected patterns which gives users an advantage by allowing the position to prepare for volatility.
- When the Harmonic Patterns Trading Tool is combined with other trading strategies, the possibilities are endless
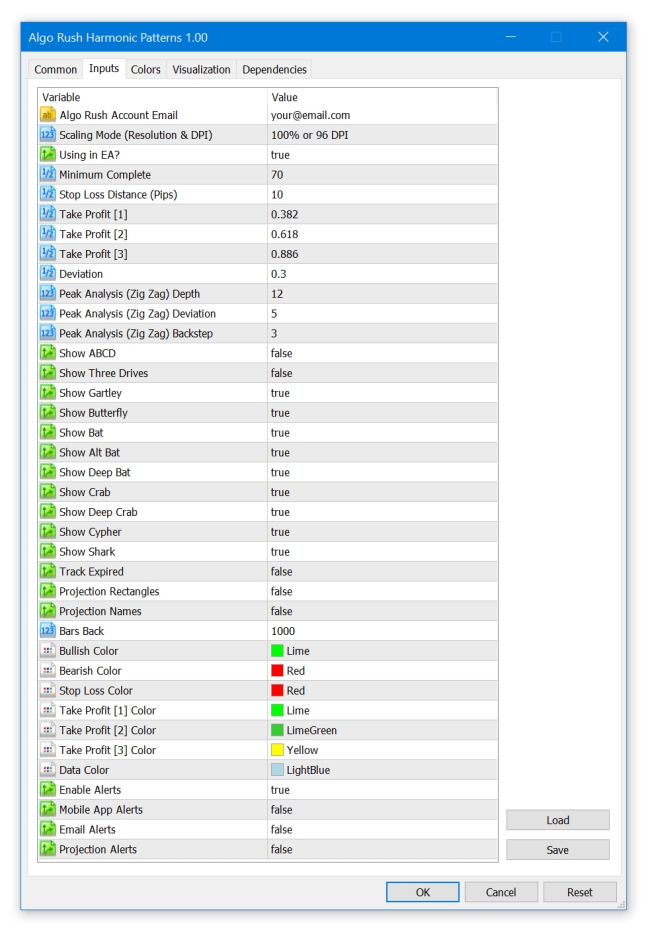
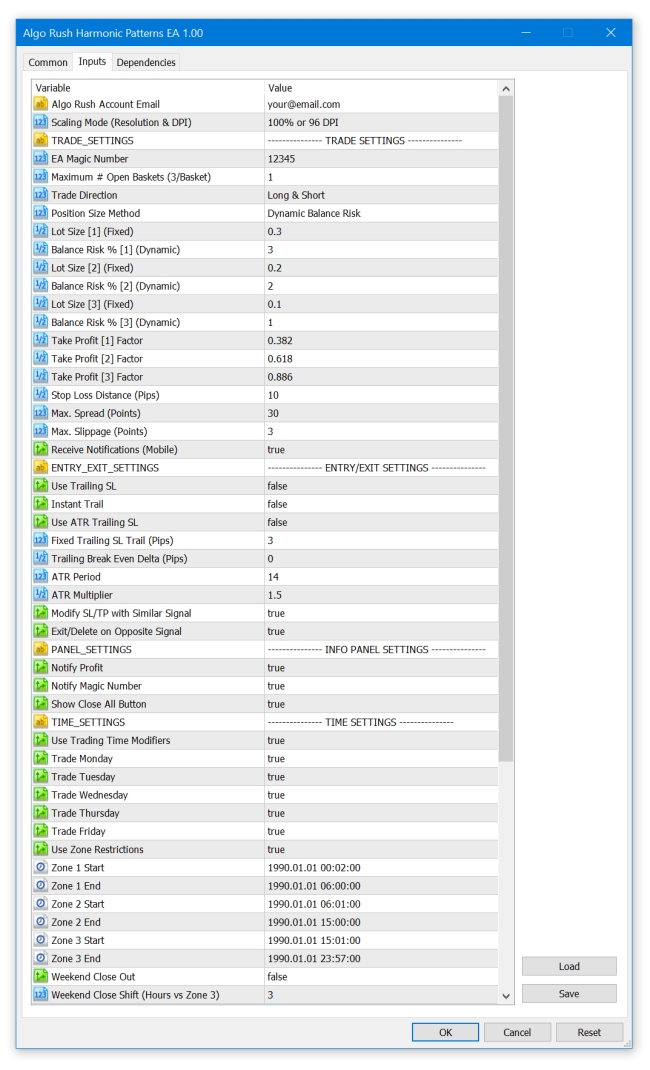
Users have the option to trade the following harmonic patterns with multiple TP levels and SL options. All parameters for TP/SL fib extension values as well as position sizing amounts per level can be configured by users.
- Entry level completion confirmation and initial position sizing
- Take Profit #1 fib extension level and position sell-off sizing
- Take Profit #2 fib extension level and position sell-off sizing
- Take Profit #3 fib extension level and position sell-off sizing
- Stop Loss fib extension level and position trailing sell-off values
Deviation
The minimum percentage that price has to change in order for the trend to change directions. The default value is 5. A trader chooses the Backstep parameter's value in accordance with what chart figures need to be identified.
- Will look for the previous low, then look for the uptrend.
- For shorts it will look for the previous high, then look for the downtrend.
In the example below, we included a variety of different zigzag lines with different deviation values. These differences in deviation values determine how strong a rebound has to be (in terms of % change) for a pivot to be considered. This works in conjunction with the “Depth” option since that option defines the minimum amount of periods (bars) required since the last rebound if the deviation rule becomes valid at any time.
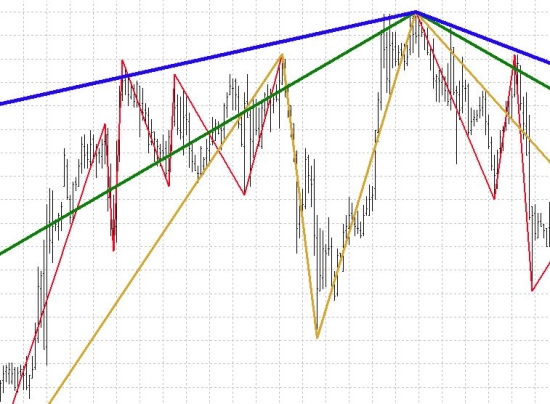
- Blue line: 5% deviation (highest deviation value, least elastic to changes)
- Green line: 3% deviation
- Yellow line: 1.5% deviation
- Red line: 1% deviation (lowest deviation value, most elastic to changes)
Depth
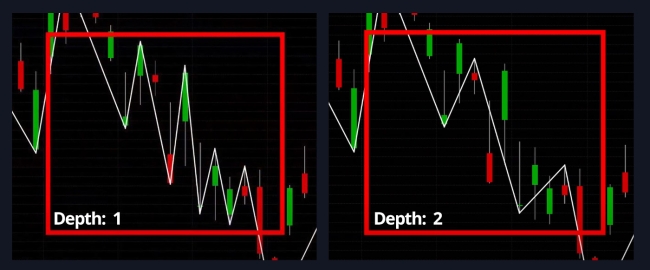
A minimum amount of periods needed for the trend to be able to change/switch. With a depth of 1, the trend can change every period (bar) however with a depth of 2 the trend can change only starting from 2 periods (bars). The value you use ultimately depends on what the length of your chosen period is. Below is an example:
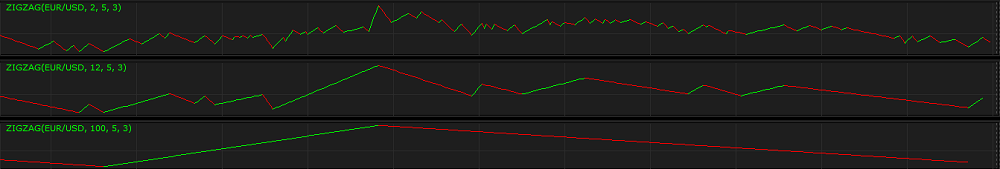
Depth - the parameter allows to specify the minimum number of periods, needed to draw one segment of the indicator's line. The possible values are from 1 through 10,000. The default value is 12. The smaller the number is, the shorter the segments are and the line changes its direction more often. The greater the number is, the longer the segments are, and the line changes its direction less frequently. A trader chooses the Depth parameter's value in accordance with what chart figures need to be identified. For identifying Harmonic Patterns and Elliott Waves, for example, the commonly used value is the default one - 12.
Below you can see examples of ZIGZAG indicators with different Depth parameter's values (2, 12, 100) drawn in additional areas.
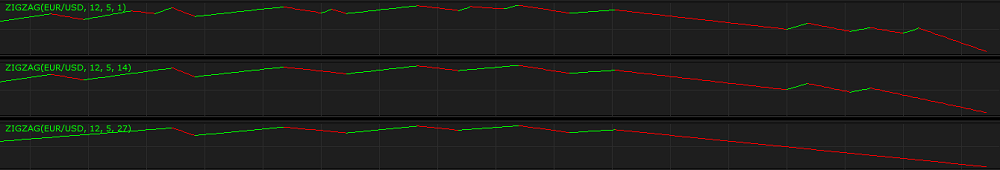
Backstep
Backstep reflects the minimum amount of bars between which the high and low can be plotted, you can think of this of the total width of the potential fib retracement/extension based off candlestick width periods. These settings should be adapted to various financial markets and you will probably end up using different settings for one market, instrument, price/harmonic pattern, and so fourth. Additionally, you could also end up changing the settings for the same market or indicator when the market conditions change along with its volatility.
Backstep - the parameter allows to specify the number of bars backwards from the current bar to be used for an assessment triggered by reaching or surpassing the Deviation parameter's value. The possible values are from 1 through 10,000. The default value is 3. The smaller the number is, the shorter the segments are and the line changes its direction more often. The greater the number is, the longer the segments are, and the line changes its direction less frequently. A trader chooses the Backstep parameter's value in accordance with what chart figures need to be identified. For identifying Elliott Waves, for example, the commonly used value is the default one - 3.
Below you can see examples of ZIGZAG indicators with different Backstep parameter's values (1, 14, 27) drawn in additional areas.
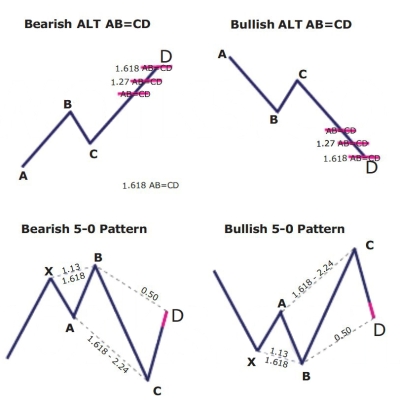
Harmonic Patterns Available
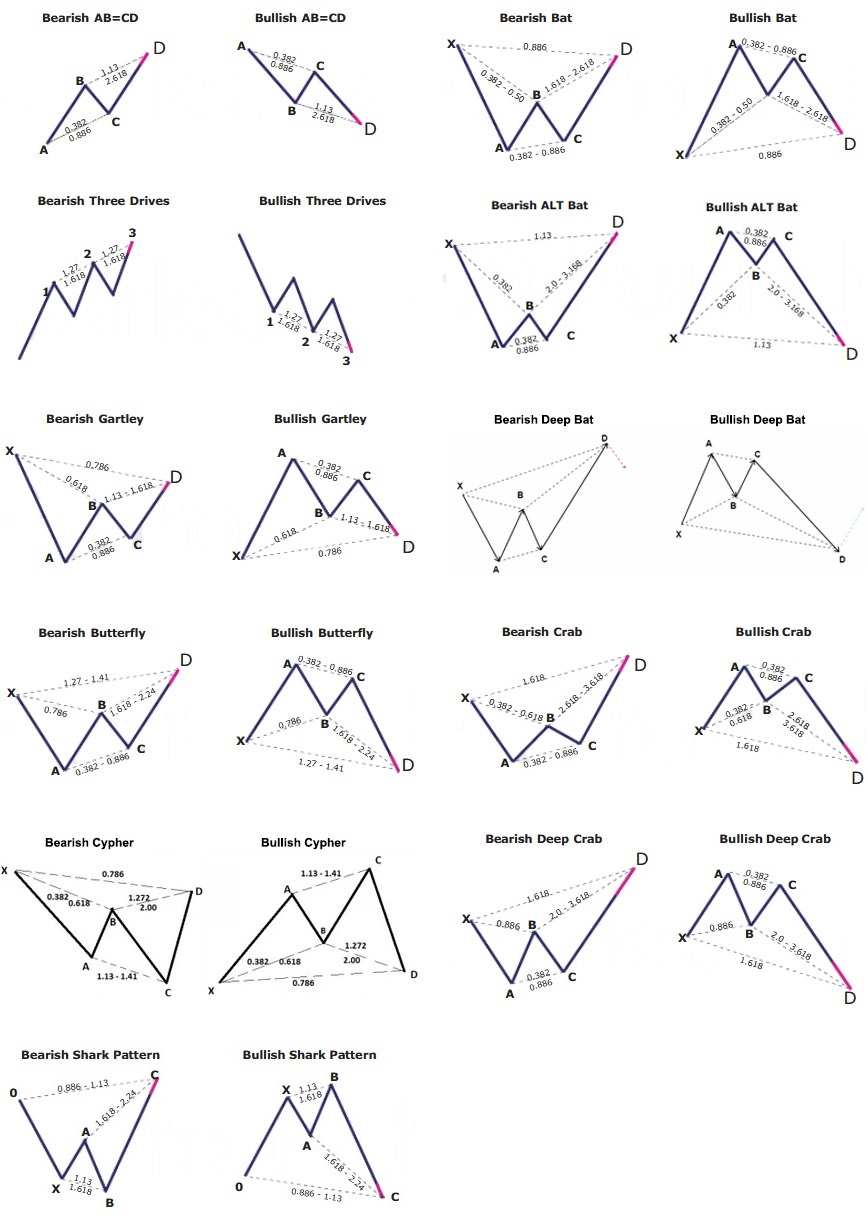
Coming Soon