Trend Breakout System
The Trend Breakout System is a trend continuation system that uses specific price structure patterns along with pivots and fractals to plot dynamic fibonacci retracements and extensions. Used for locating ranges that determine entries as well as various targets and stoplosses.
The Expert Advisor (EA), indicator and dashboard are available for MetaTrader 4 & 5. The system works seamlessly with Forex, commodities, indices, equities, cryptocurrencies and more. Trading trend continuations within existing technical analysis setups providers traders with additional support for pinpointing positions of entries along with their targets.
System Overview
The trend continuation (following) system explained:
- Uses strategic pivot locations to base price pattern projections from the most recent close price.
- Price pattern projections include customizable Fibonacci level options to begin entries, stoploss moves, trailing activation and take-profits.
Determining Swing Low & Swing High Locations
Before traders enter into a trend continuation trade, it's a must that the swing low and swing high are determined in order to produce a retracement of a trend line that will be used as an extension.
Our users have the option to base their swing high and swing low off of the following mechanisms:
- Pivot High & Pivot Low
- Double Top and Double Bottom
- Triple Top & Triple Bottom
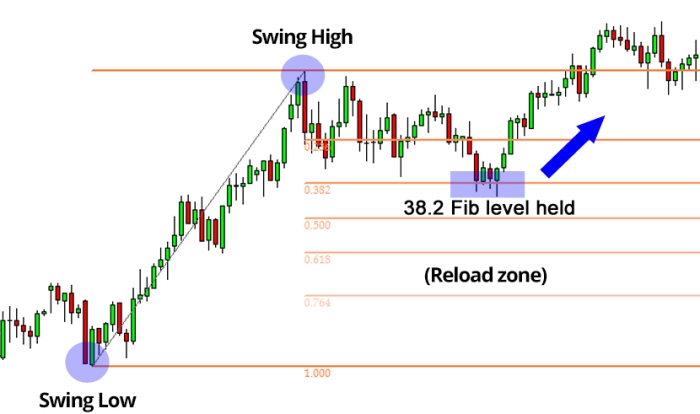
*Note: Above is just a general example of how a trend continuation setup would be formed. The Trend Breakout's method uses the ability to properly quantify and plot these high and low swing locations along with the custom criteria used for determining when to begin placing the following extension fib within the trend bias.
*For more details on input configurations visit the indicator and EA pages of this setup.
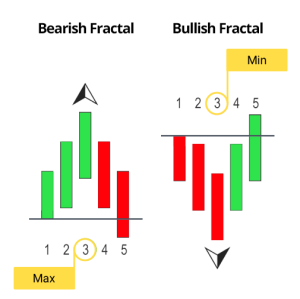
Pivot High & Pivot Low
By definition, the fractal mark is placed above the third candlestick if it is a maximum or minimum within a series of 5 candlesticks. Our system calculates the classic bullish and bearish 5-bar fractal by scanning 2 candles to the left and right from the middle candle. Users have the option to customize the length of the fractal if they wish to do so. Increasing the length could provide both positives and negatives, more details are explained later on. The example below illustrates the fractals that we use as pivots.
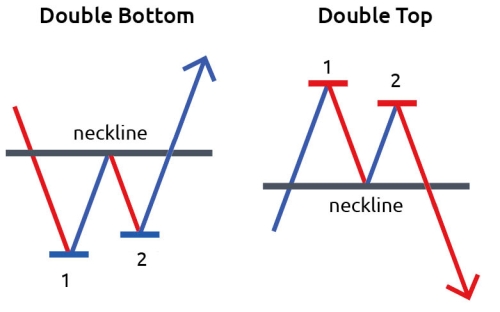
Double Top & Double Bottom
By definition, proper structure for double bottoms include the right side being higher than the left side and for double tops the right side must be lower than the left side.
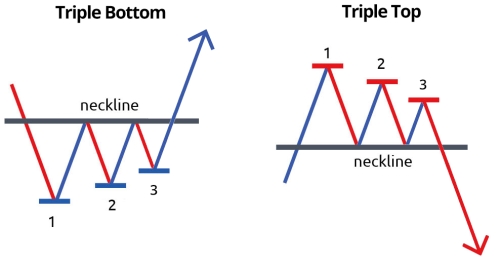
Triple Top & Triple Bottom
The same is said for triple bottoms and triple tops except there is one additional side that is formed which must be lower than the previous two lows or highs.
Trend Breakout Implementation
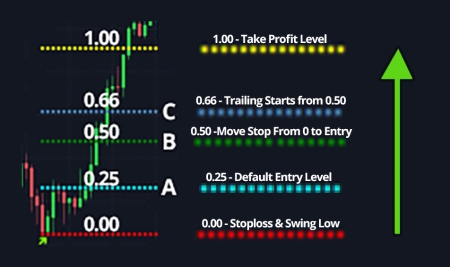
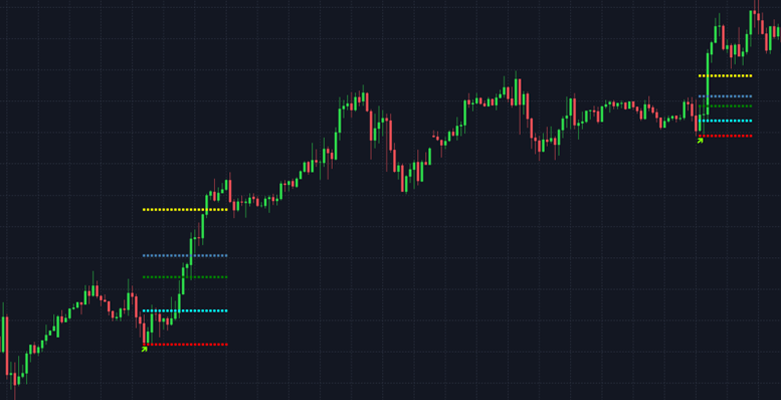
In the example we have plotted the same Fibonacci retracement that the Trend Breakout System would have calculated automatically behind the scenes (based on the same low and high swing rules just with the option for pivots (fractals), double bottoms/tops and triple bottoms/tops as minimas and maximas. The long Trend Breakout setup appears within the 0.382 and 0.500 levels with the “Pivot Low” option enabled. Our in-house trading system allows for additional measures which include custom acceptance levels, trend indicators and price patterns to further determine the eligibility of new setups. These additional measures have been vetted over the years and are quantifiable unlike traditional trend continuation setups which requires manual discretionary charting due to the lack of technical depth required to pinpoint these swings without a human eye.
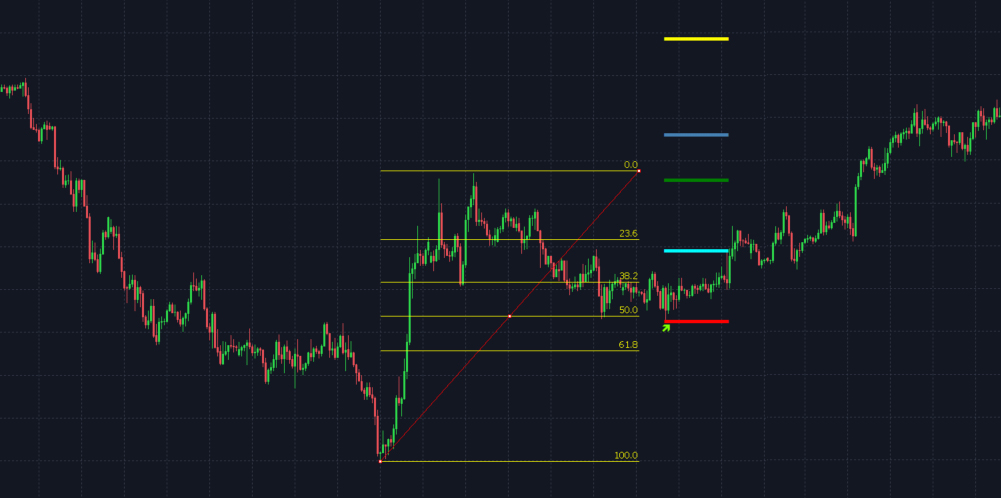
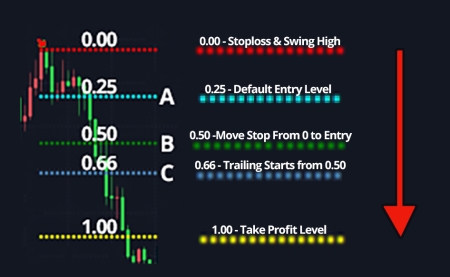
- Starting Point (red line) - Fixed level: 0
- The level in which the setup starts from. By default it's also the first stoploss used unless the Stoploss offset option is used. Depending on the “Search Width” and “Rebound Style” options used.
- Point A (light blue line) - Default customizable level: 0.25
- The level in which positions can begin to enter into a trade.

- Point B (green line)- Default customizable level: 0.50
- The level in which the stoploss is moved from the 0 fib level (or lower if offset is used) to the entry price above Point A.

- Point C (dark blue line) - Default customizable level: 0.66
- The level in which positions begin trailing. The trailing price amount is defined as the distance between 0.50 and 0.66.

- Ending Point (yellow line) - Fixed level: 1.00
- The level in which the setup starts from. By default it's also the first stoploss used unless the Stoploss offset option is used.
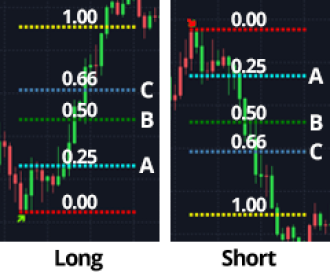
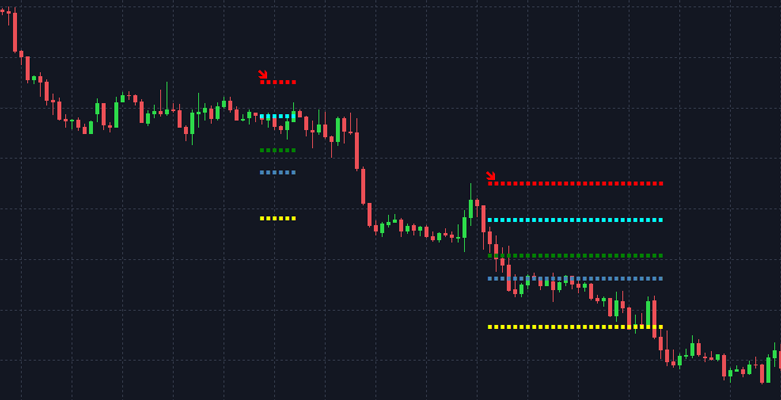
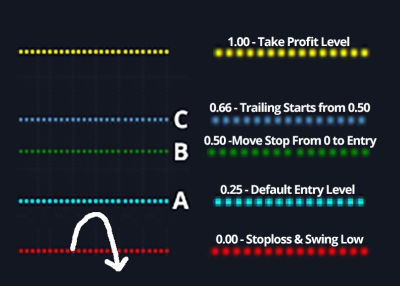
Note: The location of the A, B and C is inverted for short Trend Breakout setups. More details are covered in this guide.
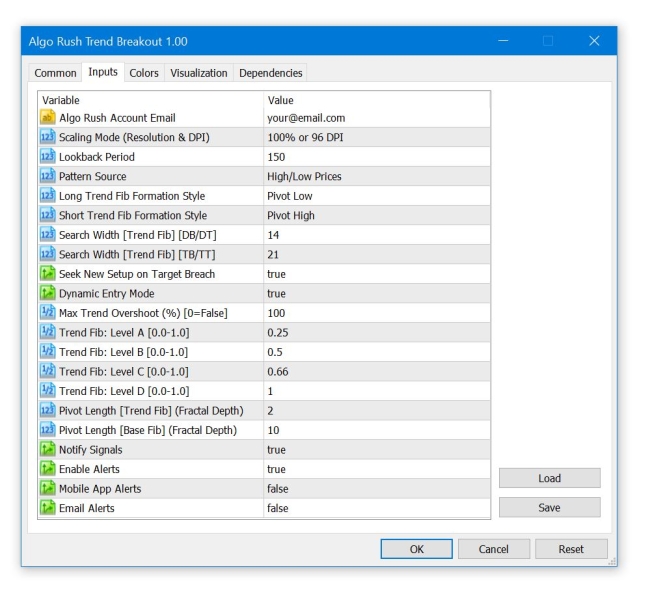
Customizable Fib Levels
The following points are each level and the sub points are the options on the indicator and EA that could be adjusted to change the level of the entry, points A to C, and final take-profit.
- Fib Level 0.00: Entry/First Stoploss
- Search Width
- Rebound Style
- Pivot Length
- Early Trend Search
- Early Forward Shift
- Trend Following Mode
- Fib Level 0.25: Point A
- CD Fib. (A) [0.0-1.0]
- Fib Level 0.50: Point B
- CD Fib. (B) [0.0-1.0]
- Fib Level 0.66: Point C
- CD Fib. (C) [0.0-1.0]
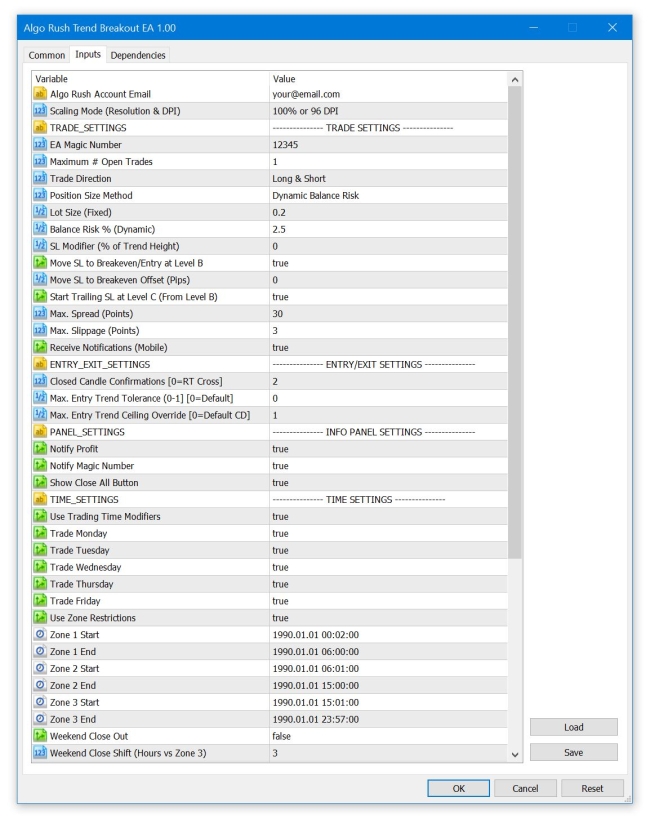
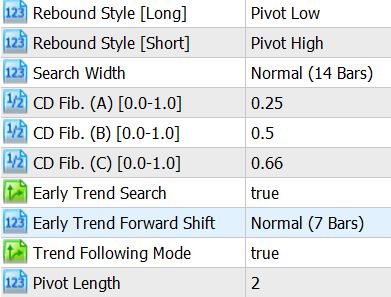
The options on the indicator & EA:
Safety Features
Note: Users can enable/disable the following safety features
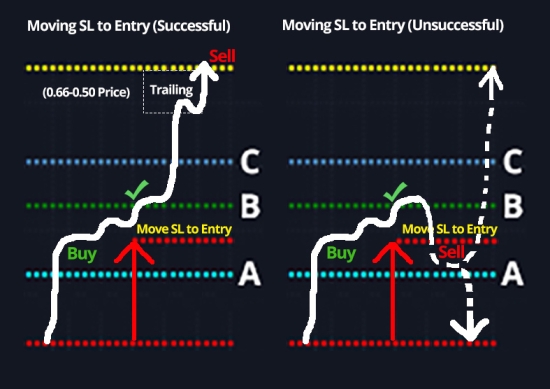
- Moving 1st made stoploss from 0 to Break Even at 0.50 (can either enable/disable or customize the point A, B and C fib levels)
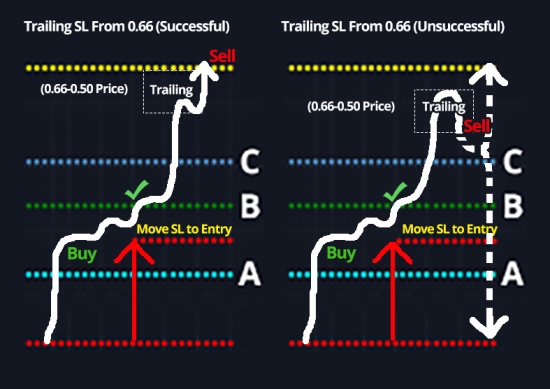
- Starting the trailing stoploss at 0.66 which calculates trailing from 0.50 (can either enable/disable or customize stoploss delta).
Below illustrates how the SL move from 0 to break even works:
Below illustrates how the trailing stoploss at 0.66 works:
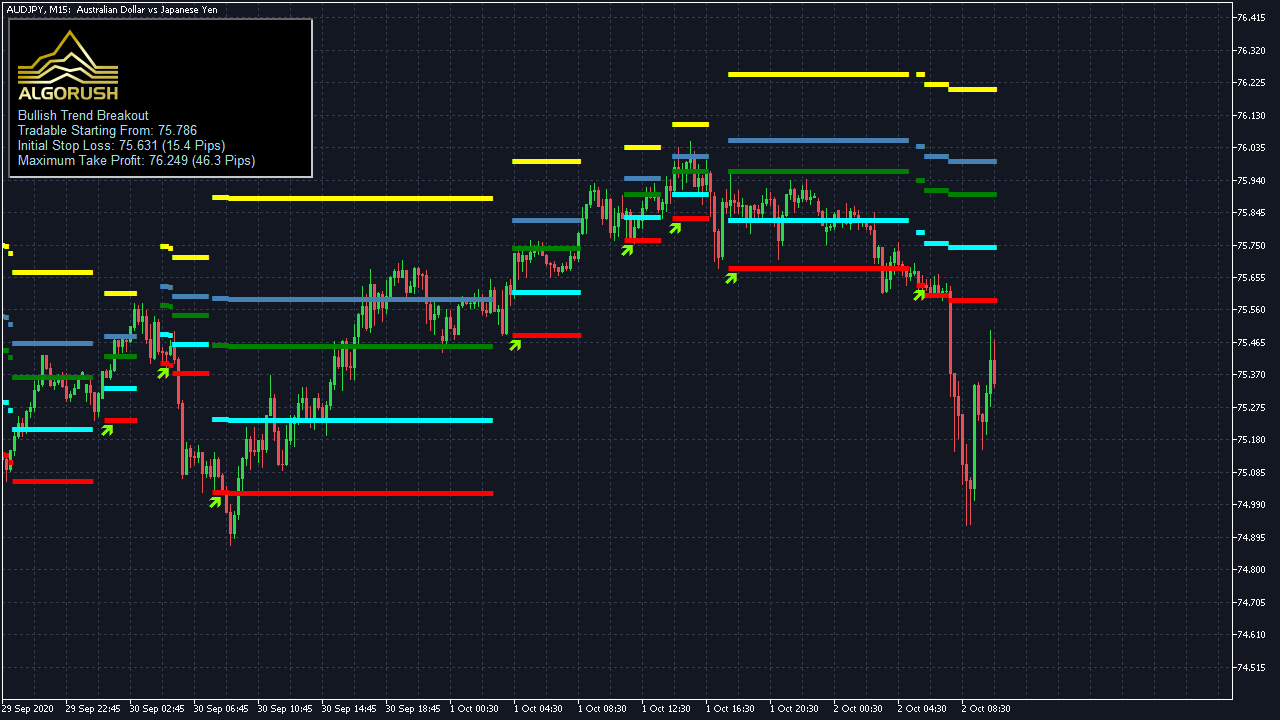
Part 1: Trend Identification
Using Pivot Low & High
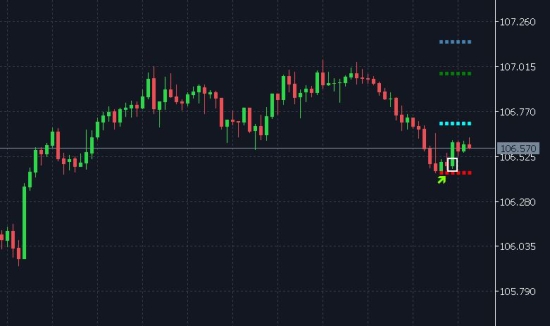
This early setup was determined right after the second candle closed (open of the third candle), to illustrate this we created a white outlined box around the price level where the signal would've confirmed and stayed (non-repainting). This same signal was also produced realtime to show the swing detection in action.
For the example above, the following parameters were used:
- Rebound Style [Long]: Pivot Low
- Search Width: Wide (21 Bars)
- Early Trend Forward Shift: Wide (11 Bars)
- Trend Following Mode: true
- Pivot Length: 2
The reason why the signal appears on the open of the 3rd candle (outlined white box) is due to the fact that the default fractal length of 2 was used. The integer 2 defines the length that our system should use to scan left and right. Therefor the default setting 2 is what is labelled as a Classical 5-bar fractal.
If the “Pivot Length” option is changed to 4, then the total fractal size would be 9 candles. The increase in length accounts for stronger fractals thus resulting in less noise, however the downside is that the pivot won't be able to confirm until the close of the 4th candle rather than the 2nd. This may result in missing out on some trades if they shoot above (long) or below (short) the entry levels prior to confirming the 4th candle.
Using Double Bottom & Double Top
If the double bottom or triple bottom method for determining swings was used, then the signal to go long or short will only appears once the price closes above or below the neckline (see diagrams above for double and triple structures and their necklines). The swings are based off the lowest point of the double bottom or high point of the double top. This method should only be used for very volatile markets since this option along with the triple strucutres will significantly reduce your tradeable setups. This is mainly due to the fact that most of these necklines on double or triple bottoms are formed and crossed far above the initial entry level.

*For more details on input configurations visit the indicator and EA pages of this setup.
Part 2: Entering a Trade
Now that trend identification for all available methods have been discussed, the steps pertaining to entering a trade with our EA (or manually) are as follows:
Long Setup
The 0.00 Fibonnaci extension is placed on the swing lows within a trend.
*Note: If “Trend Continuation” is enabled, up to 2 more setups may arise if price continues to fall yet stay within an acceptable levels and parameters when trying to go long.
Bullish Upward Trend
Short Setup
The 0.00 Fibonnaci extension is placed on the swing highs within a trend.
Note: If “Trend Continuation” is enabled, up to 2 more setups may arise if price continues to rise yet stay within an acceptable levels and parameters when trying to go short.
Bearish Downward Trend
Part 3: Scenarios for Different Trailing & Stoplosses
Scenario 1
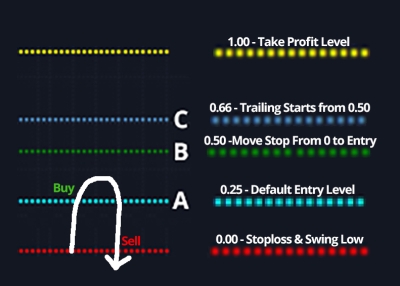
- The price does not break Point A (0.25 level) and instead breaks below the 0.00 fib level. Setup is the invalidated.
Scenario 2
- The price first breaks Point A (0.25 level) and either confirms the entry in real-time, one candle close, or on the 2nd candle close.
- The price does not break the 0.50 fib level and instead breaks the 0.00 fib, then the setup will become invalidated.
Note: Users can enable/disable the following safety features to have a different outcome occur:
- Either realtime crossing, one or two candle close confirmations for entering past 0.25 (or any custom Point A level).
- Moving 1st made stoploss from 0 to Break Even at 0.50 (can either enable/disable or customize the point A, B and C fib levels).
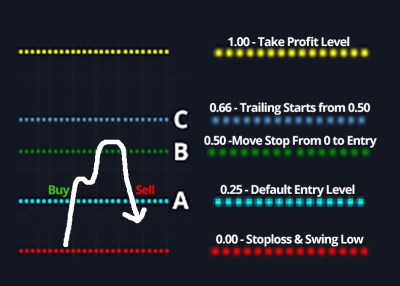
Scenario 3
- The price first breaks Point A (0.25 level) and either confirms the entry in real-time, one candle close, or on the 2nd candle close.
- The price breaks the 0.50 fib level (Point B) and the stoploss is moved to the entry price.
- The price however falls below the entry level (around 0.25 region) thus resulting in a break even trade (minus fees and spread).
Note: Users can enable/disable the following safety features to have a different outcome occur:
- Either realtime crossing, one or two candle close confirmations for entering past 0.25 (or any custom Point A level).
- Moving 1st made stoploss from 0 to Break Even at 0.50 (can either enable/disable or customize the point A, B and C fib levels).
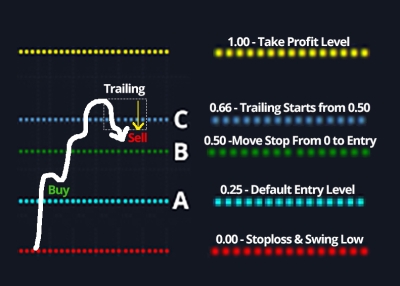
Scenario 4
- The price first breaks Point A (0.25 level) and either confirms the entry in real-time, one candle close, or on the 2nd candle close.
- The price breaks the 0.66 fib, level (Point C) thus resulting in the trailing stoploss being activated. The distance of the trailing is determined by the difference between the price on the 0.50 level and 0.66 level.
Note: Users can enable/disable the following safety features to have a different outcome occur:
- Either realtime crossing, one or two candle close confirmations for entering past 0.25 (or any custom Point A level).
- Moving 1st made stoploss from 0 to Break Even at 0.50 (can either enable/disable or customize the point A, B and C fib levels).
- Starting the trailing stoploss at 0.66 which calculates trailing from 0.50 (can either enable/disable or customize stoploss delta).
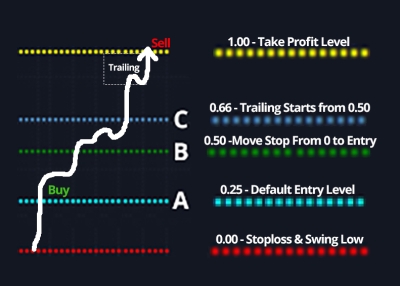
Scenario 5
- The price first breaks Point A (0.25 level) and either confirms the entry in real-time, one candle close, or on the 2nd candle close.
- The price breaks the 0.66 fib, level (Point C) thus resulting in the trailing stoploss being activated. The distance of the trailing is determined by the difference between the price on the 0.50 level and 0.66 level.
- The price breaks the 1.00 fib while not trailing down an excess of the spread between 0.66 and 0.50.
Note: Users can enable/disable the following safety features to have a different outcome occur:
- Either realtime crossing, one or two candle close confirmations for entering past 0.25 (or any custom Point A level).
- Moving 1st made stoploss from 0 to Break Even at 0.50 (can either enable/disable or customize the point A, B and C fib levels).
- Starting the trailing stoploss at 0.66 which calculates trailing from 0.50 (can either enable/disable or customize stoploss delta).
*For more details on input configurations visit the indicator and EA pages of this setup.