Trading with technical analysis demands traders to depend mostly on a mixture of technical indicators and trade based on the signals from this approach. Apart from using technical indicators, traders also utilize chart patterns to base their trading decisions, whether to sell or buy. In this article, we’ll deep dive into the Three Drives harmonic pattern.
Harmonic trading is an advanced area. Even though it is more difficult than regular technical elements, can show great trading opportunities. Harmonic trading uses structural analysis, Fibonacci ratios, and symmetry. It allows them to describe patterns in the market which tend to yield significant outcomes.
Although chart patterns are more qualitative than other indicators, they can provide great insights into the psychology of the market at any given period, making them necessary tools for traders.
Harmonic price patterns enable us to distinguish possible areas for a continuation of the overall trend.
Six Harmonic Price Patterns
There are six harmonic price patterns:
- The ABCD Pattern
- The Three-Drive Pattern
- The Gartley Pattern
- The Crab Pattern
- The Bat Pattern
- The Butterfly Pattern
3-Step Price Pattern Recognition Process
The three basic steps in spotting harmonic price patterns are the following
- Step 1: Locate a potential harmonic price pattern
- Step 2: Measure the potential harmonic price pattern
- Step 3: Buy or sell on the completion of the harmonic price pattern
Again, harmonic price patterns are so perfect that they are very difficult to spot.
More than knowing the steps, you need to have hawk-like eyes to spot potential harmonic price patterns and a lot of patience to avoid jumping the gun and entering before the pattern is completed.
With enough practice and experience, trading using harmonic price patterns can yield a lot of pips!
Introduction
Chart Pattern recognition is the basic and primary ability any trader develops in Technical Analysis. It may be basic development, but the perfection of pattern recognition takes extensive practice and repetitive exposure. The expert recognition of patterns helps traders to quantify and react to the changing market environment. Chart patterns are categorized into “continuous” and “reversal” patterns, which are further classified as simple and complex patterns. The complex patterns structures may consist of collections of simple patterns and combination of prior swings. The knowledge of this classification of pattern recognition and its properties give traders greater potential to react and adapt to a wider range of trading conditions.
Market prices always exhibit trend, consolidation and re-trend behavior. They rarely reverse their trends and transitional phases to turn from a previous trend on a single bar. During this transitional phase, they experience trading ranges and price fluctuations. This ranging action defines identifiable price patterns. These consolidation phases occasionally favor prevailing trends prior to their formation and continue their direction. These are called “continuation” patterns. Examples of these patterns include Symmetrical Triangle, Flags and Cup and Handle. Some phases result in a reversal of the prior trend and continuing in the new direction. These are called “reversal” patterns. Examples of these patterns include Head and Shoulders, Double Bottoms and Broadening Patterns.
Harmonic Patterns
The concept of Harmonic Patterns was established by H.M. Gartley in 1932. Gartley wrote about a 5-point pattern (known as Gartley) in his book Profits in the Stock Market. Larry Pesavento has improved this pattern with Fibonacci ratios and established rules on how to trade the “Gartley” pattern in his book Fibonacci Ratios with Pattern Recognition. There are few other authors who have worked on this pattern theory, but the best work to my knowledge is done by Scott Carney in his books of “Harmonic Trading.” Scott Carney also invented patterns like “Crab,” “Bat,” “Shark” and “5-0” and added real depth of knowledge for their trading rules, validity and risk/money management.
The primary theory behind harmonic patterns is based on price/time movements which adhere to Fibonacci ratio relationships and its symmetry in markets. Fibonacci ratio analysis works well with any market and on any timeframe chart. The basic idea of using these ratios is to identify key turning points, retracements and extensions along with a series of the swing high and the swing low points. The derived projections and retracements using these swing points (Highs and Lows) will give key price levels for Targets or Stops.
Harmonic patterns construct geometric pattern structures (retracement and projection swings/legs) using Fibonacci sequences. These harmonic structures identified as specified (harmonic) patterns provide unique opportunities for traders, such as potential price movements and key turning or trend reversal points. This factor adds an edge for traders as harmonic patterns attempt to provide highly trustworthy information on price entries, stops and targets information. This may be a key differentiation with other indicators/oscillators and how they work.
Examples of Harmonic Patterns
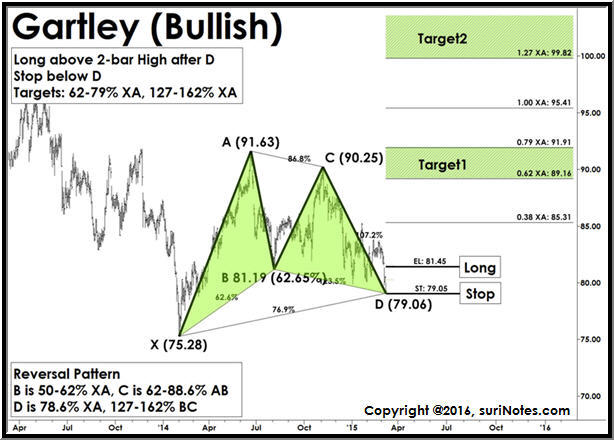
The Gartley pattern shown below is a 5-point bullish pattern. These patterns resemble “M” or “W” patterns and are defined by 5 key pivot points. Gartley patterns are built by 2 retracement legs and 2 impulse swing legs, forming a 5-point pattern. All of these swings are interrelated and associated with Fibonacci ratios. The center (eye) of the pattern is “B,” which defines the pattern, while “D” is the action or trigger point where trades are taken. The pattern shows trade entry, stop and target levels from the “D” level.
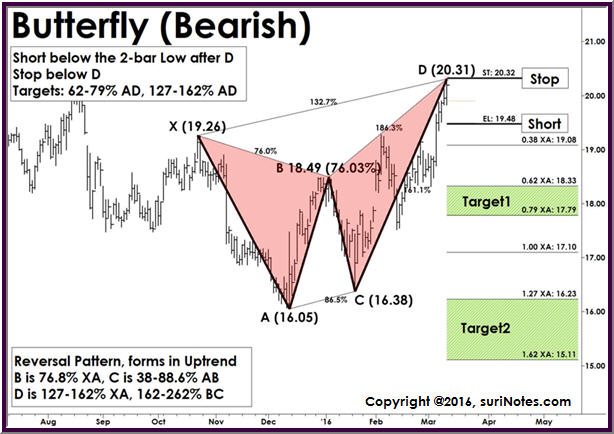
The following chart shows another 5-point harmonic pattern (Butterfly Bearish). This pattern is similar to the above 5-point Gartley pattern, but in reverse. Here the pattern is “W”-shaped with “B” being the center (eye) of the pattern. The pattern shows trade entry, stop and target levels from “D” levels using the “XA” leg.
List of Harmonic Patterns
Fibonacci Discussion
Any discussion on harmonic patterns must include Fibonacci numbers, as these patterns use Fibonacci ratios extensively. Fibonacci numbers are pervasive in the universe and were originally derived by Leonardo Fibonacci. The basic Fibonacci ratio or “Fib ratio” is the Golden Ratio (1.618). Fibonacci numbers are a sequence of numbers where each number is the sum of the previous two numbers.
The series of Fib Numbers begin as follows: 1,1,2,3,5,8,13,21,34,55,89,144,233,317,610….
There are plenty of materials and books about the theory of how these numbers exist in nature and in the financial world. A list of the most important Fib ratios in the financial world, which are derived by squaring, square-rooting and reciprocating the actual Fibonacci sequence, is shown below.
Key set of Fibonacci-derived ratios in trading: 0.382, 0.618, 0.786, 1.0, 1, 1, 2.0, 2.62, 3.62, 4.62
Secondary set of Fibonacci-derived ratios in trading: 0.236, 0.886, 1.13, 2.236, 3.14, 4.236
There are many applications of Fibonacci in technical analysis. Some of the applications include Fibonacci retracements, Fibonacci projections, Fibonacci Fans, Fibonacci Arcs, Fibonacci Time Zones and Fibonacci Price and Time Clusters, among others.
Most trading software packages have Fibonacci drawing tools which can show Fibonacci retracements, extensions and projections. Additionally, Fibonacci numbers can also be applied to “time” and “price” in trading.
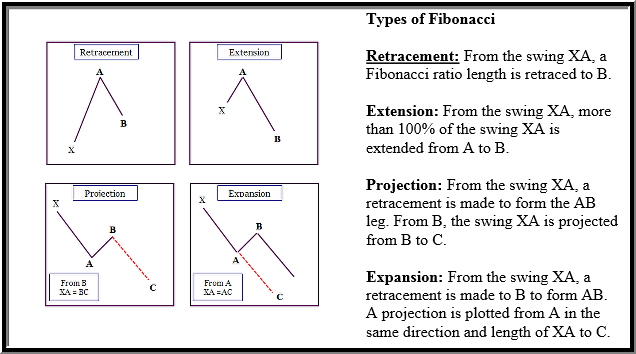
The graphic below illustrates how Fibonacci ratios are used to apply retracement, extension, projection and expansion swings.
Advantages & Disadvantages of Harmonic Patterns
Advantages:
-
Provide future projections and stops in advance, making them leading indicators
-
Frequent, repeatable, reliable and produce high probable setups
-
Trading rules are relatively standardized using Fibonacci ratios
-
Work well with defined Market Context, Symmetry and Measured Moves rules
-
Work in all timeframes and in all market instruments
-
Other indicator theories (CCI, RSI, MACD, DeMark…) can be used along with them
Disadvantages:
-
Complex and highly technical, making it difficult to understand
-
Correct identification and automation (coding) of harmonic patterns is difficult
-
Conflicting Fibonacci retracements/projections can create difficulty in identifying reversal or projection zones
-
Complexity arises when opposing patterns form from either the same swings or other swings/timeframes
-
Risk/reward factors from non-symmetric and low-ranked patterns are pretty low
Now that you’ve got the basic chart patterns down, it’s time to move on and add some more advanced tools to your forex trading arsenal.
In this lesson, we’ll be looking at harmonic price patterns.

These bad boys may be a little harder to grasp but once you spot these setups, it can lead to some very nice profits!
The whole idea of these patterns is that they help people spot possible retracements of recent trends.
In fact, we’ll make use of other tools we’ve already covered – the Fibonacci retracement and extensions!
Combining these wonderful tools to spot these harmonic price patterns, we’ll be able to distinguish possible areas for a continuation of the overall trend.
In this lesson, we’re going to discuss the following Harmonic Price Patterns:
- ABCD Pattern
- Three-Drive Pattern
- Gartley Pattern
- Crab Pattern
- Bat Pattern
- Butterfly Pattern
Phew! That’s quite a lot to cover!
But don’t you worry… Once you get the hang of things, it’ll be as easy as 1-2-3!
We’ll start off with the more basic ABCD and three-drive patterns before moving on to Gartley and the animals.
After learning about them, we’ll take a look at the tools you need in order to trade these patterns successfully in the forex market.
For all these harmonic price patterns, the point is to wait for the entire pattern to complete before taking any short or long trades.
You’ll see what we’re talking about later on so let’s get started!
Harmonic price patterns are those that take geometric price patterns to the next level by utilizing Fibonacci numbers to define precise turning points. Unlike other more common trading methods, harmonic trading attempts to predict future movements.
Let’s look at some examples of how harmonic price patterns are used to trade currencies in the forex market.
KEY TAKEAWAYS
- Harmonic trading refers to the idea that trends are harmonic phenomena, meaning they can subdivided into smaller or larger waves that may predict price direction.
- Harmonic trading relies on Fibonacci numbers, which are used to create technical indicators.
- The Fibonacci sequence of numbers, starting with zero and one, is created by adding the previous two numbers: 0, 1, 1, 2, 3, 5, 8, 13, 21, 34, 55, 89, 144, etc.
- This sequence can then be broken down into ratios which some believe provide clues as to where a given financial market will move to.
- The Gartley, bat, and crab are among the most popular harmonic patterns available to technical traders.
Geometry and Fibonacci Numbers
Harmonic trading combines patterns and math into a trading method that is precise and based on the premise that patterns repeat themselves. At the root of the methodology is the primary ratio, or some derivative of it (0.618 or 1.618). Complementing ratios include: 0.382, 0.50, 1.41, 2.0, 2.24, 2.618, 3.14 and 3.618. The primary ratio is found in almost all natural and environmental structures and events; it is also found in man-made structures. Since the pattern repeats throughout nature and within society, the ratio is also seen in the financial markets, which are affected by the environments and societies in which they trade.
By finding patterns of varying lengths and magnitudes, the trader can then apply Fibonacci ratios to the patterns and try to predict future movements. The trading method is largely attributed to Scott Carney,1 although others have contributed or found patterns and levels that enhance performance.
Issues with Harmonics
Harmonic price patterns are precise, requiring the pattern to show movements of a particular magnitude in order for the unfolding of the pattern to provide an accurate reversal point. A trader may often see a pattern that looks like a harmonic pattern, but the Fibonacci levels will not align in the pattern, thus rendering the pattern unreliable in terms of the harmonic approach. This can be an advantage, as it requires the trader to be patient and wait for ideal set-ups.
Harmonic patterns can gauge how long current moves will last, but they can also be used to isolate reversal points. The danger occurs when a trader takes a position in the reversal area and the pattern fails. When this happens, the trader can be caught in a trade where the trend rapidly extends against them. Therefore, as with all trading strategies, risk must be controlled.
It is important to note that patterns may exist within other patterns, and it is also possible that non-harmonic patterns may (and likely will) exist within the context of harmonic patterns. These can be used to aid in the effectiveness of the harmonic pattern and enhance entry and exit performance. Several price waves may also exist within a single harmonic wave (for instance, a CD wave or AB wave). Prices are constantly gyrating; therefore, it is important to focus on the bigger picture of the time frame being traded. The fractal nature of the markets allows the theory to be applied from the smallest to largest time frames.
To use the method, a trader will benefit from a chart platform that allows them to plot multiple Fibonacci retracements to measure each wave.
Types of Harmonic Patterns
There is quite an assortment of harmonic patterns, although there are four that seem most popular. These are the Gartley, butterfly, bat, and crab patterns.
Harmonic Patterns are a type of complex patterns that occur naturally in financial charts based on geometric price action and Fibonacci levels.
The patterns were introduced to the trading world by Harold McKinley Gartley in 1932. Gartley created a pattern which he named after himself and outlined in his 1935 book, Profits in the Stock Market.
When properly identified, harmonic patterns allow traders to enter the trade in a high probability reversal zone with minimal risk. Harmonic trading techniques utilize Fibonacci price patterns and numbers to quantify these relationships.
They offer a means to establish where the turning points will occur.
What are Harmonic Patterns?
Harmonic patterns are trend reversal patterns that are based on the Fibonacci extensions, retracement levels, and geometric structures.
These patterns provide traders the potential reversal zone, which help to hop in reversal trades at the brink of exhaustion.
What do these patterns look like?
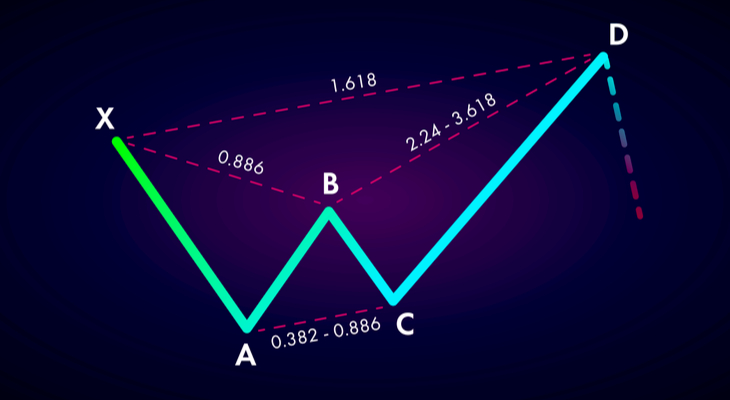
In general, all harmonic patterns are based from 5 turning points in price.
However, each type of harmonic pattern has a different geometrical shape and Fibonacci ratio. We name these points X, A, B, C and D. Each harmonic patterns follows its own set of rules that will discuss in greater detail later in the article.
Why these patterns important?
The main importance of harmonic patterns is to predict price movements.
By finding patterns of different magnitudes and lengths and applying Fibonacci coefficients to them, day traders can try to forecast the future movement of financial instruments like stocks, options, and more.
Harmonic patterns are the key to identifying reversals. They are a very precise instrument, characterizing very specific price movements.
Trading Harmonic Patterns
Trading Harmonic Patterns is similar to trading any other chart pattern.
Here are the main factors to consider:
- Practice trading these patterns in a simulator before using real money
- Always have a profit and loss target before entering the trade
- Establish where each patterns entry and exit points are
- Only trade A+ setups
Bottom Line
Every trader wants to become successful at trading. Learning to trade the market using harmonic patterns is not hard. They are one of the most useful patterns if plotted correctly.
However, don’t forget that harmonic trading has some inherent pitfalls and it is a rules-based method which requires discipline.
To make harmonic patterns more reliable, make sure to pay attention to support and resistance levels. Combine this with price action reversal patterns such as bullish or bearish engulfing to give yourself some confidence.
Finally, remember to set your stop losses and target levels to reasonable price levels.
Fine-Tune Entries and Stop Losses
Each pattern provides a potential reversal zone (PRZ), and not necessarily an exact price. This is because two different projections are forming point D. If all projected levels are within close proximity, the trader can enter a position at that area. If the projection zone is spread out, such as on longer-term charts where the levels may be 50 pips or more apart, look for some other confirmation of the price moving in the expected direction. This could be from an indicator, or simply watching price action.
A stop loss can also be placed outside the furthest projection. This means the stop loss is unlikely to be reached unless the pattern invalidates itself by moving too far.
The Bottom Line
Harmonic trading is a precise and mathematical way to trade, but it requires patience, practice, and a lot of studies to master the patterns. The basic measurements are just the beginning. Movements that do not align with proper pattern measurements invalidate a pattern and can lead traders astray.
The Gartley, butterfly, bat, and crab are the better-known patterns that traders watch for. Entries are made in the potential reversal zone when price confirmation indicates a reversal, and stop losses are placed just below a long entry or above a short entry, or alternatively outside the furthest projection of the pattern.
Key takeaways:
- The 5-0 pattern is a reversal harmonic pattern.
- It follows specific fibonacci ratios (which you can read more below)
The patterns are relatively new but are getting more popular lately. It stands out from the other harmonic patterns because it is meant to begin a new trend rather than discover retracement. There are two types of this pattern, bullish and bearish.
The convergence zones discovered with the help of the shark pattern makes it possible for us to accurately detect the rebound but doesn’t necessarily lead to the restoration of the previous trend. On the other hand, regular rollbacks aim to determine the ability of the forces dominant on the market in the previous period (bears or bulls) to get the initiative back to their disposal. If they are not sufficient, the last reversal of the previous trend occurs, but already within another pattern – 5-0 harmonic pattern.
How to identify the 5-0 pattern?
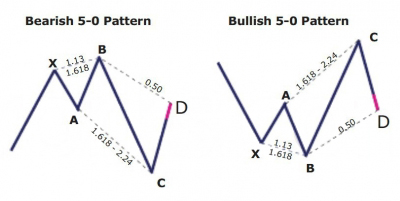
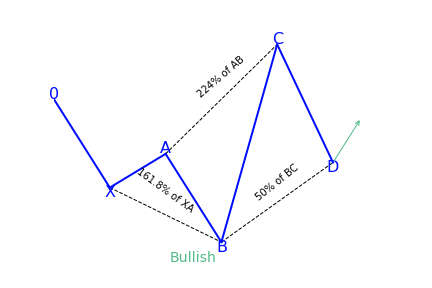
The 5-0 pattern begins with either an uptrend or a downtrend which gets exhausted and draws zigzag like corrective movements. The qualities of the 5-0 pattern to look at include:
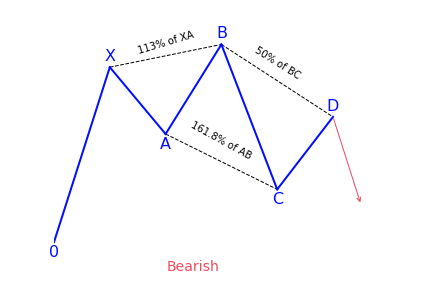
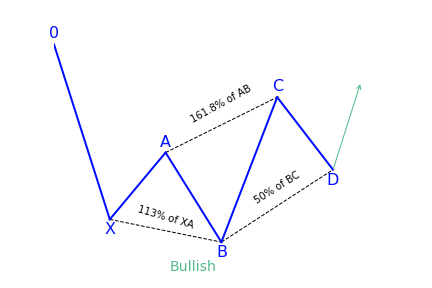
- AB movement has to be 1.13 to 1.618 retracement of XA.
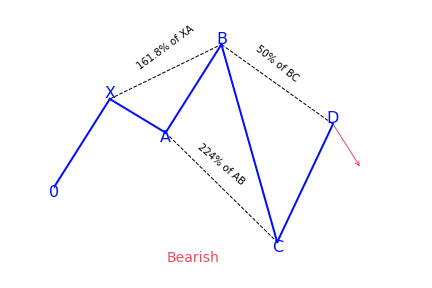
- BC movement has to be 1.618 to 2.24 retracement of an AB.
- CD movement ought to be 0.5 retracements of BC
- C should be between 0.886 and 1.13 of 0X movement
If the conditions are satisfied, some traders trade the last leg of CD. They entering at C with a stop below 2.24 of AB retracement and aiming at 50 percent correction of BC movement.
The 5-0 harmonic pattern is traded when the price is getting to point D. The stop-loss is positioned a few ticks below/above the farthest possible D level. Unlike a lot of the other patterns, 5-0 doesn’t have specific targets because it usually begins a new trend. Here the pattern fib ratios don’t matter much. Entries might be done with a limit order or on price reversals away from point D. All entries have to be confirmed for risk/reward ratio. Entries having less risk/reward have to be taken cautiously or discarded altogether.
A reliable indicator should automatically scan for, recognize, display, and alert emerging 5-0 and other harmonic chart patterns. It indicates the name of the pattern, when it happened, and the stop price. The pattern scanner goes through various charts in the same period and assists traders to find trading opportunities as soon as they come up.
Bearish 5-0 pattern
To correctly identify the bearish 5-0 pattern, first, find the shark pattern, wait for the implementation of its targets at 88.6 or 113 percent, and the following rollback in the direction of 50 percent of the BC wave. The length of this wave in both graphic configurations is 161.8 to 224 percent of AB. If after the convergence zones of the shark pattern is reached, a correction in the direction of 23.6 percent, 38.2 percent, or 50 percent has followed, we can talk about the transformation of the real pattern into 5-0.
What does the 5-0 pattern tell traders?
The 5-0 harmonic chart pattern suggests a long entry upon completion of the pattern or confirmation of the D point of the pattern. The pattern is a unique 5-point reversal structure that typically shows the first pullback of an important trend reversal. It is a relatively new pattern that has 4 legs and particular Fibonacci measurements of each point within the structure, creating room for better flexible interpretation. The Potential Reversal Zone (PRZ) is described differently from other harmonic chart patterns.
Conservative traders look for more confirmation before getting into a trade. Targets for this pattern can be placed at the discretion of the trader as the reversal point could be the beginning of a new trend. Common stop-loss levels are found behind a structure level beyond the D point or the next vital level for the Fibonacci sequence.
How to trade when you see the 5-0 pattern?
One of the best processes of interpreting this pattern is to look at it from a tired and frustrated trader’s point of view. Taking the bullish 5-0 pattern as an example, then we can see why. The AB leg ends with B below X, making a lower low. We then get a longer move in time where the BC leg is the most prolonged move with C ending over A.
The movement from B to C may look like a bear flag or bearish pennant. C to D indicates intense shorting pressure and a belief among bears that new lows are on the way. Rather, we get to D – the 50 percent retracement of BC. Rather than new lower lows, we get a confirmation swing forming a higher low. That move will most probably create a brand new trend reversal or significant corrective move.
The elements of trading the 5-0 pattern
- The pattern starts (with 0) at the beginning of a long price move
- After 0 has formed, an impulse reversal at X, A, and B should have a 113 to 161.8 percent extension
- The projection off of AB has a 161.8 percent extension requirement to C. C can extend beyond the 161.8 percent extension but not beyond 224 percent.
- D is the 50 percent retracement of BC and is same as AB
- The reciprocal AB=CD is needed
Drawing the 5-0 pattern properly
To perfectly draw or locate a 5-0 harmonic chart pattern on the price chart, first of all, we need to locate the X and A points of the pattern. The X point is seen at the bottom of a strong bearish trend. The A point is found at the top of a bullish trend. The next thing traders need to do is to draw a Fibonacci retracement tool from X to A to determine the B point of the chart pattern. The B point should be within the 113 percent to 161.8 percent Fibonacci retracement of XA.
In the last step, we will get the entry point, D point, of the 5-0 harmonic chart pattern. To get the D point of the pattern, draw a Fibonacci retracement tool from B to C. The D point has to be at the 50 percent Fibonacci retracement of BC.
Traders can be sure when the D point of the pattern is confirmed. The stop-loss for the order should be set at the lower support level. The profit target for the order should be placed within the 50 to 88.6 percent Fibonacci retracement of CD.
The C axis can also be traded, if it is the D point of a bearish harmonic chart pattern. The B point can be traded if the entries are confirmed by the other tools for technical analysis.
References
https://patternswizard.com/5-0-harmonic-pattern/
https://harmonictrader.com/harmonic-patterns/5-0/
https://www.liteforex.com/blog/for-beginners/5-0-pattern-shark-hunt/
https://www.orbex.com/blog/en/2017/03/catch-key-reversals-5-0-pattern
https://algorush.com/trading-academy/advanced-lessons/harmonic-patterns/harmonic-trading-patterns/5-0-pattern/
