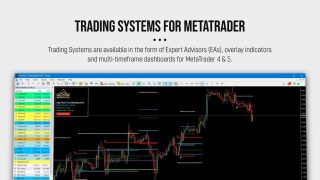
Trading Systems
Built for MetaTrader 4 & 5
Ultimate Breakout Trading System
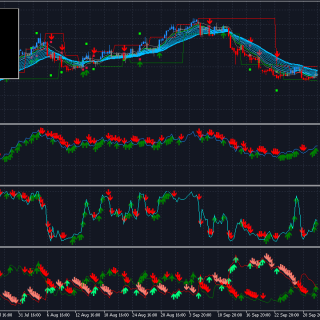
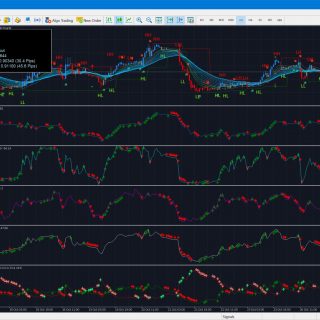
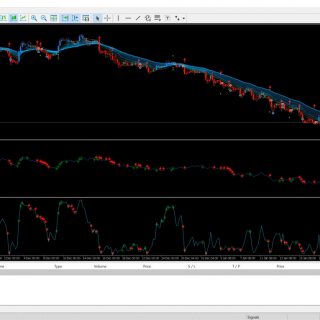
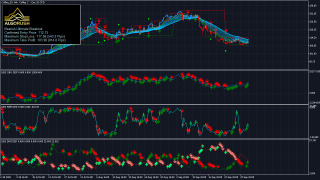
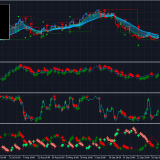
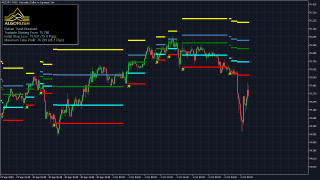
The Ultimate Breakout System automates breakout trading by generating double bottom and double top structural breakout patterns from price action (all price forms) as well from five momentum, volatility and volume indicators which include OBV, RSI, WPR, DMI and MFI. Breakout trading is most ideal for traders who trade price breakouts on more confirming higher timeframes such as H4, H12, Daily and Weekly during both uptrending and downtrending market conditions.
In addition to price action and multi-indicator breakout detection, the system uses four underlying trend modifiers within the existing breakout trading strategy to assist with additional confirmations for entries and early stoploss and take-profit triggers. These trend modifiers are derived from existing trend trading strategies which include pullback, scalping, reversal and ATR-ADX multiplier. These trend modifiers can be used separately or in conjunction with one another to determine the trend direction real-time.
The trading system works on Forex, stocks, commodities, futures, crypto and other liquid asset classes. Trading using breakout patterns within existing trading setups providers traders with additional support for pinpointing high probability entry levels within both bullish and bearish market conditions.
What’s included in The Ultimate Breakout Trading System:
- Ultimate Breakout Indicator for MetaTrader 4 & 5
- Ultimate Breakout Expert Advisor (EA) for MetaTrader 4 & 5
- Ultimate Breakout Multi-Pair/Timeframe Dashboard for MetaTrader 5
- Indicator, EA and dashboard user guides/documentation on our wiki
- Order Snipe MT5 Bridge Addon: Interactive Brokers & Crypto Exchanges
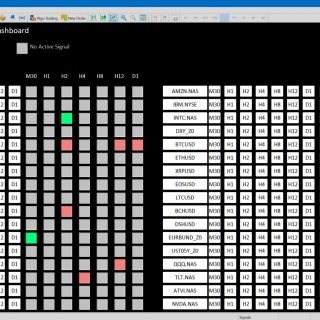
Indicator Dashboard Expert Advisor (EA)
Tradingview, NinjaTrader, eSignal & MultiCharts versions coming soon.
The Ultimate Breakout System is included in our subscription package which comes equipped with all trading systems and billed either monthly, quarterly or annually.
SubscribeProduct Description
Ultimate Breakout System Overview
Ultimate Breakout System Overview
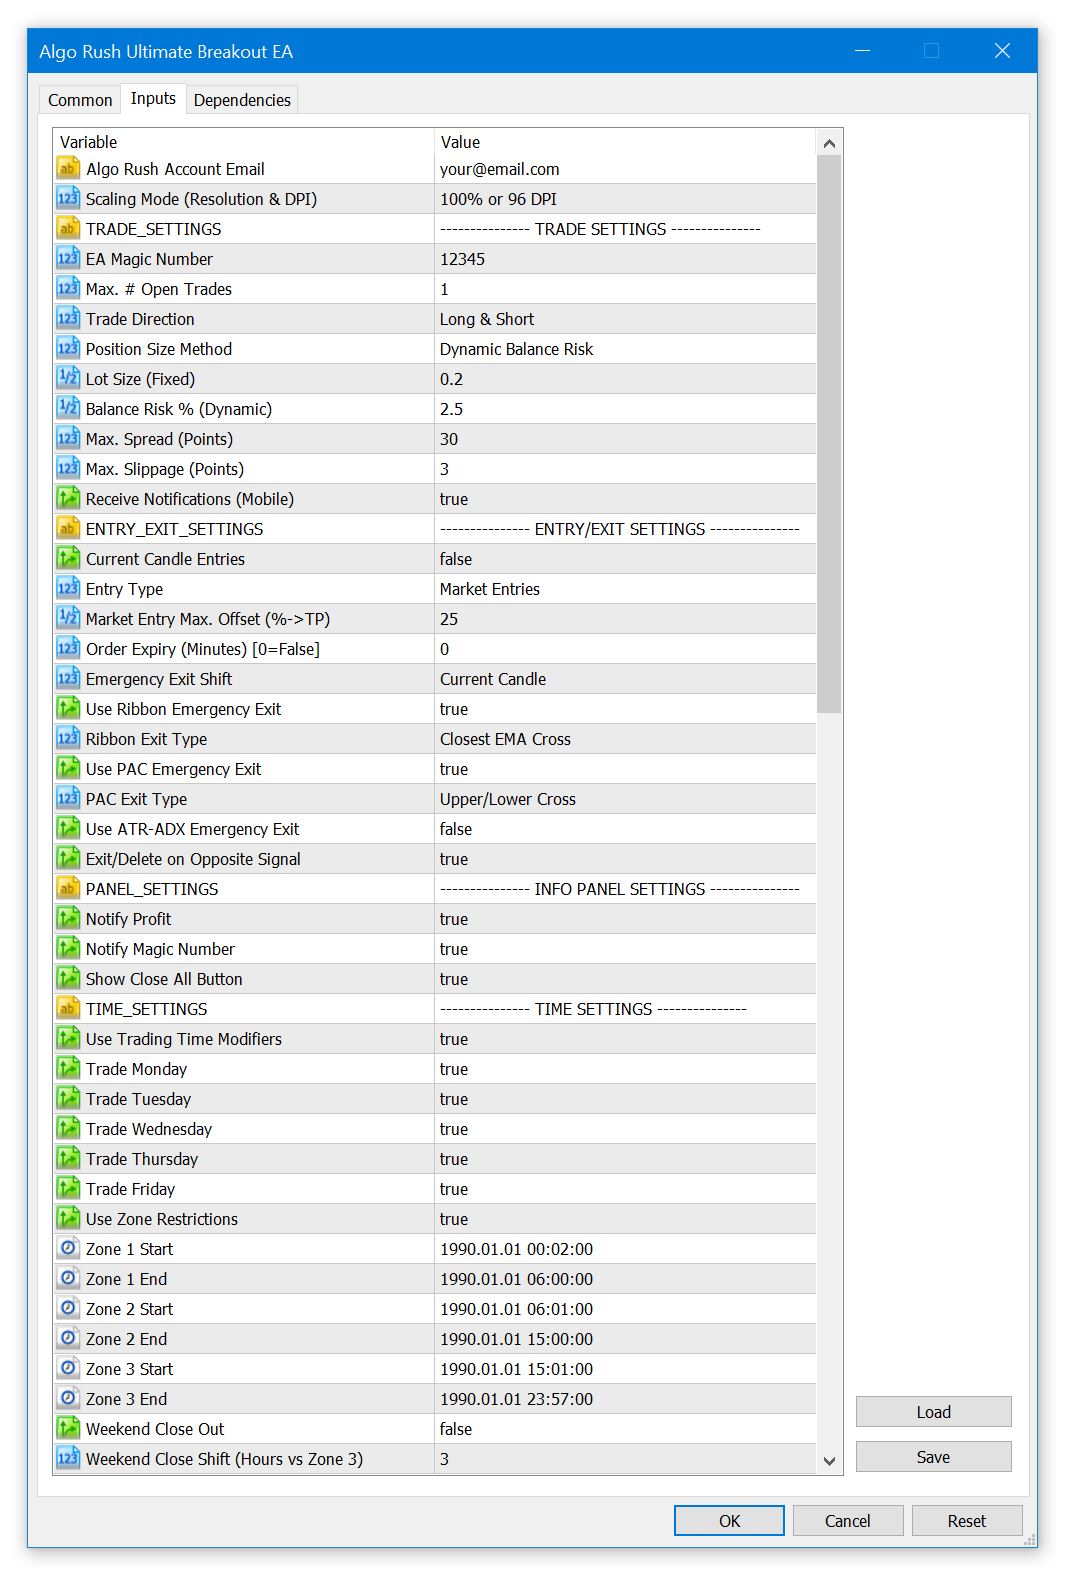
The Ultimate Breakout System uses four different underlying trend modifiers to determine the direction of the market. Breakouts are generated within price data and five various indicators within uptrend and downtrend conditions.
The Expert Advisor (EA), indicator and dashboard are available for MetaTrader 4 & 5. The system works seamlessly with Forex, commodities, indices, equities, cryptocurrencies and more. Trading breakouts within existing technical analysis setups providers traders with additional support for pinpointing positions of entries along with their targets.
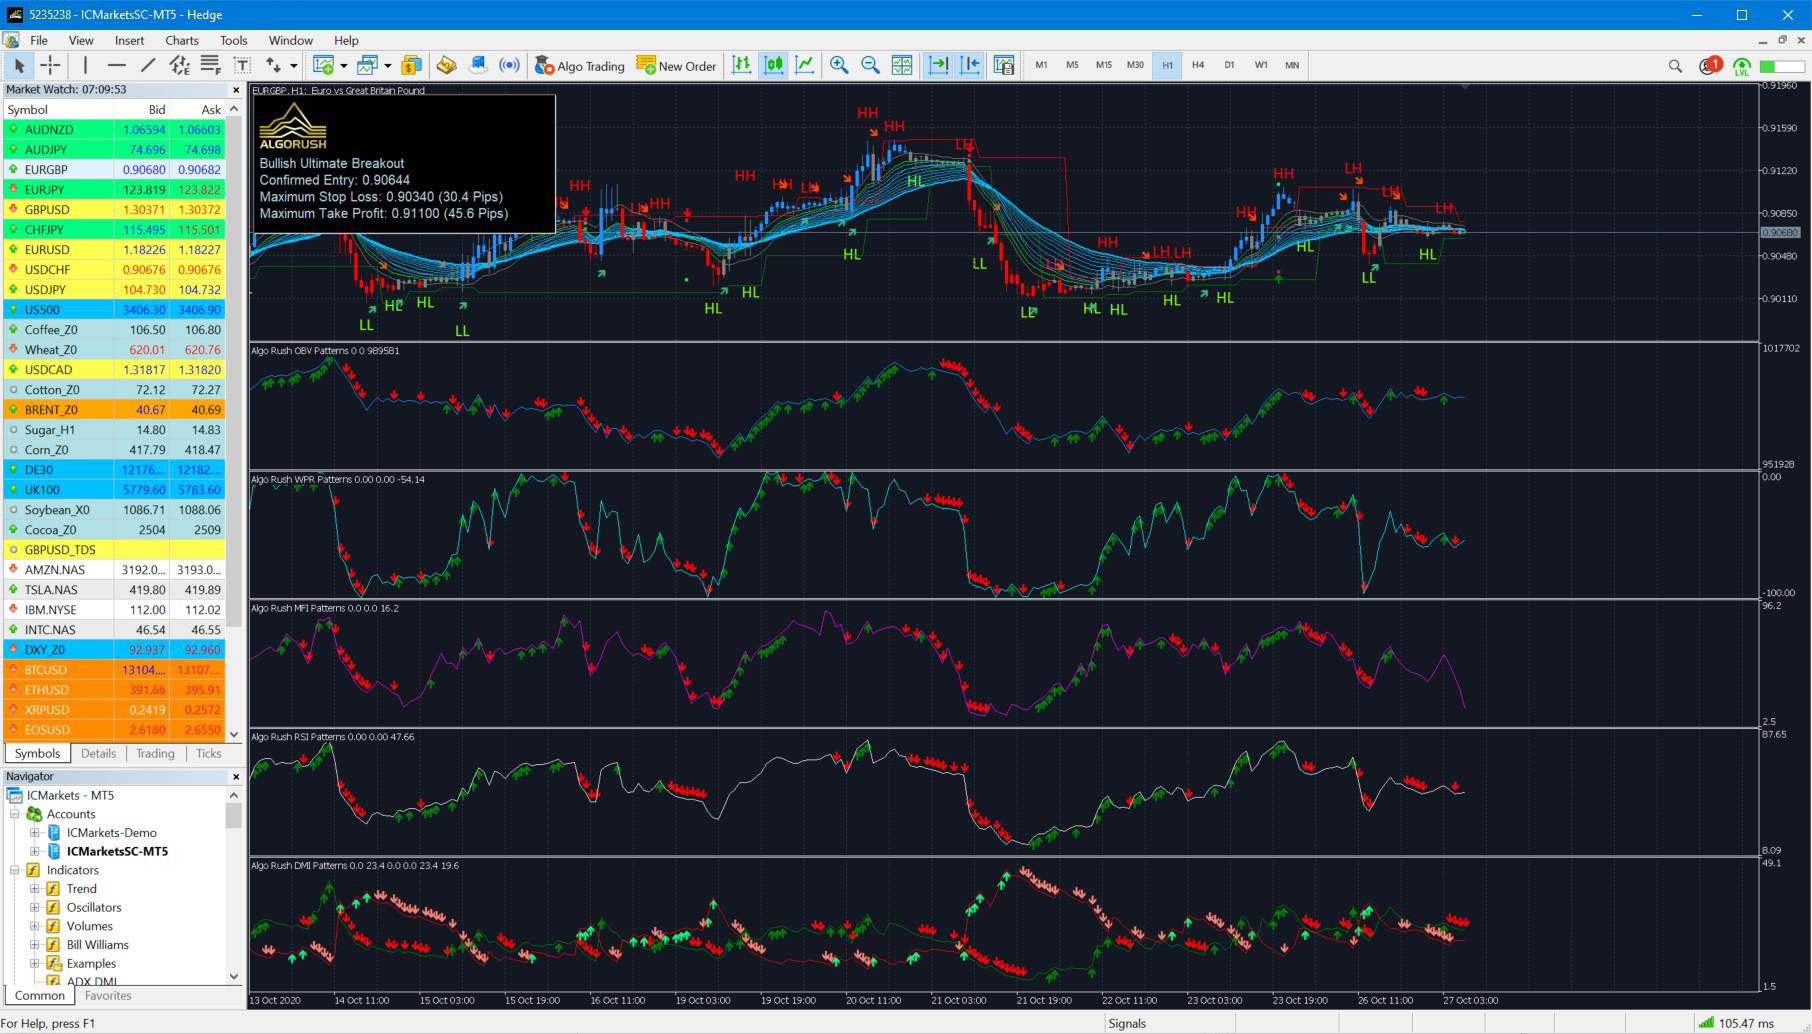
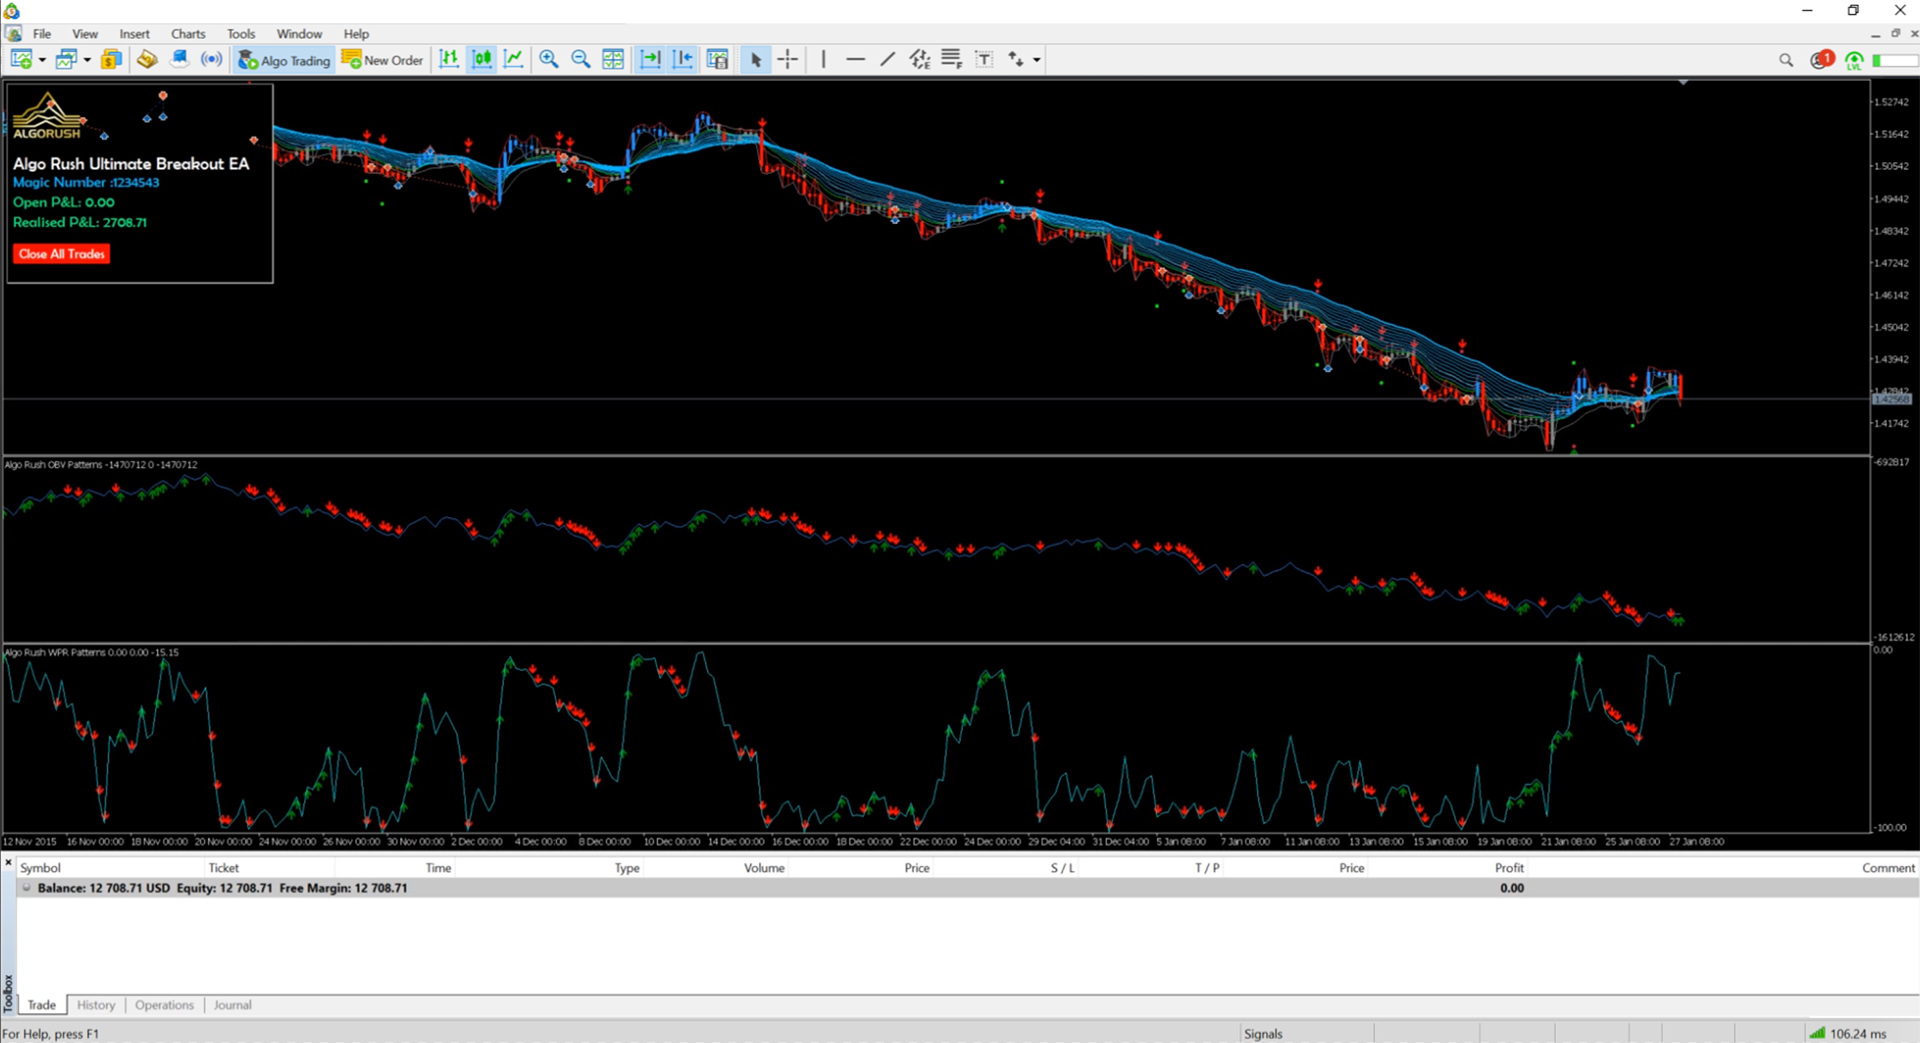
The Ultimate Breakout Setup is given the name it deserves due to the tremendous amount of trading styles it comes equipped with. This setup can be broken down into two main parts with several indicators and trading styles.
Reversal breakouts scanned within the following indicators:
-
-
-
Detects double bottoms and double tops within
-
Price Candles (close or low/high)
-
Williams %R (WPR)
-
On Balance Volume (OBV)
-
Relative Strength Index (RSI)
-
Money Flow Index (MFI)
-
DMI (DI+ and DI-)
-
-
-
Trend identification indicators & safety exit measures used:
-
-
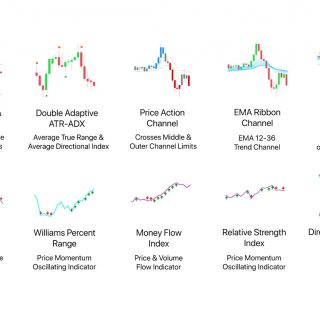
- Double Adaptive ATR-ADX
-
Price Action Channel (PAC) Cross
-
EMA Ribbon Cross
-
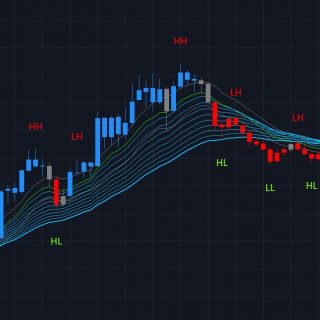
Fractals Pivots
- Pivot points (HH, LH, LL, HL)
- Fractal levels with swing analysis
-
Supported platforms for each system component:
–
Ultimate Breakout Indicator
-
-
- Ultimate Breakout Indicator for MetaTrader 4 (MT4)
- Ultimate Breakout Indicator for MetaTrader 5 (MT5)
-
Ultimate Breakout Expert Advisor (EA)
-
- Ultimate Breakout Expert Advisor (EA) for MetaTrader 4 (MT4)
- Ultimate Breakout Expert Advisor (EA) for MetaTrader 5 (MT5)
- Recommended for machine learning when performing fast and slow genetic optimizations
Ultimate Breakout Dashboard
-
-
- Ultimate Breakout Dashboard for MetaTrader 5 (MT5)
-
Coming soon to the following charting & trading platforms:
-
-
- Tradingview
- NinjaTrader
- eSignal
- MultiCharts
-
Breakout trading lessons are coming soon:
-
-
- Breakout Trading 101
- What are Reversal Breakouts
- How to Trade Breakouts
- Breakouts Within Price Action
- Breakouts Within Indicator Data
- Swing & Pullback Trend Methods
- EMA Ribbon Channels
- Price Action Channel (PAC)
- Fractal Pivot Analysis
- Double Adaptive ATR-ADX
- Locating Breakout Patterns
- Price Candles (All Price Forms)
- Williams Percent Range (WPR)
- On Balance Volume (OBV)
- Relative Strength Index (RSI)
- Money Flow Index (MFI)
- Directional Movement Index (DMI)
- Breakout Trading 101
-
References
https://algorush.com/wiki/ultimate-breakout-system-overview
https://algorush.com/trading-systems-for-metatrader/ultimate-breakout-overview/
Start Trading Breakouts
Learn Breakout Trading
Recent Trading Guides
-
December 18, 2020
Harmonic Patterns Explained For Beginners
-
November 17, 2020
Trading Breakouts within Price Action & Multiple Indicators
-
October 28, 2020
Importing High Quality Tick Data on MetaTrader 4 & 5
Looking for User Guides?
Instructions for Algo Rush Expert Advisors, Indicators & Dashboards.
Trading Systems
-
From: $19.99 / month with 1 week free trial
Ultimate Breakout Indicator
Ultimate Breakout Indicator
The Ultimate Breakout Indicator is available on MetaTrader 4 (MT4) and MetaTrader 5 (MT5). Traders can determine the trend with four different methodologies while scanning for precise and non-precise breakouts within price action and five various indicators. The ultimate breakout indicator can also be loaded on Order Snipe to allows users to view charts and trade stocks and futures charts on Interactive Brokers (IB) as well as crypto on several crypto exchanges including Binance, BitMEX, FTX, KuCoin and more.

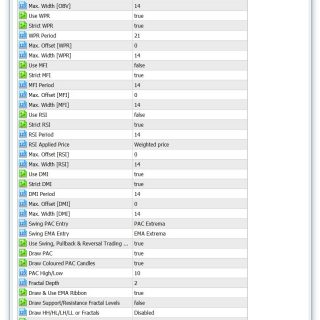
Ultimate Breakout Indicator Settings on MetaTrader 4 & 5
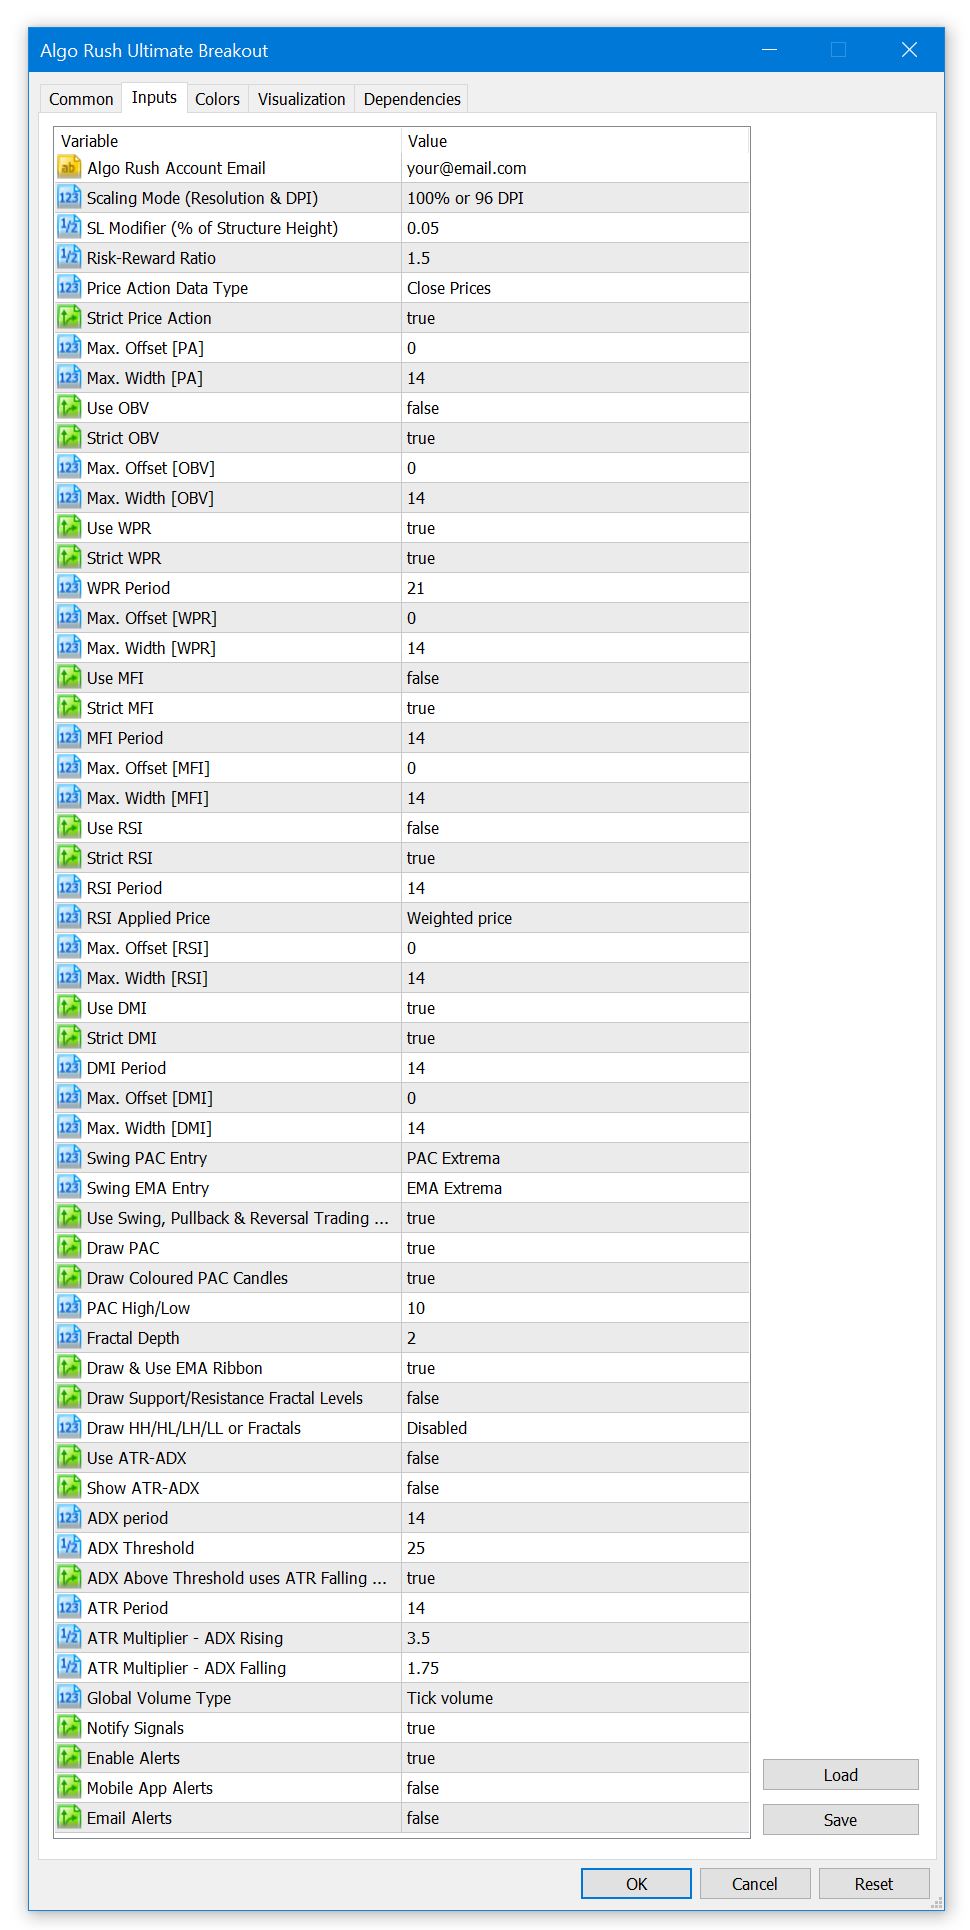
Algo Rush Account Email
The email address that the active Algo Rush subscription is under.
- Note: The indicators and Expert Advisors will not initiate without an email address linked to an active subscription.
Scaling Mode (Resolution & DPI)
Users with either resolutions above 1080p (1920×1080) or DPIs above 96 will need to adjust the scaling mode settings to an option above the default 100% value. Adjusting this will resolve any issues with displaying objects such as text, buttons and windows within active charts.
- 100% or 96 DPI (default)
- 125% or 120 DPI
- 150% or 144 DPI
- 175% or 168 DPI
- 200% or 192 DPI
- 225% or 216 DPI
- 250% or 240 DPI
SL Modifier (% of Structure Height)
The option to set an additional percentage offset away from the entry level and the calculated low of the double bottom or high of the double top structure.
- Default: 0.05 (5%)
Risk-Reward Ratio
The risk reward ratio is calculated by multiplying the distance between the anticipated entry level and the low of the double bottom (or high of the double top) to determine take profit levels. A risk-reward of 2-1 (default option) indicates that the distance of the take-profit from the desired entry level is twice the distance as the distance of the stop-loss from the desired entry level.
- Default: 2
Price Action Data Type
The price action data type is referring to the price form used to calculate structures within timeframe specific candle data.
- Close Prices (default)
- The close price will be used to calculate double bottoms and double tops for both directions.
- High & Low Prices
- For going long, the low price will be used to calculate double bottoms within price data.
- For going short, the high price will be used to calculate double tops within price data.
Strict Price Action
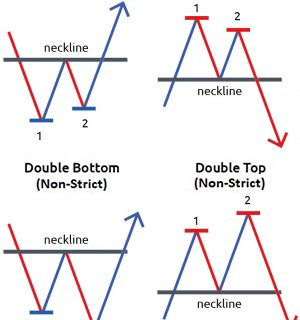
Defines if the double bottom or double top needs to have have a proper structure. By definition, proper structure for double bottoms include the right side being higher than the left side and for double tops the right side must be lower than the left side. If disabled, all double top and bottom structures will be accounted for within Price close or high/low data (depends on the option chosen above) regardless if proper or not. See image below:
- Default: True
Max. Offset [PA]
How many bars back a double bottom or double top structure is allowed to be formed within price data for the upcoming signal.
- Default: 0
Max. Width [PA]
Over how many bars a double bottom or double top structure is allowed to form a signal on price data.
- Default: 14 (a double bottom/top must form within the last 14 candlesticks)
Use OBV
Scan for double bottom and double top breakout structures within On Balance Volume (OBV) indicator data.
- Default: False
Strict OBV
Defines if the double bottom or double top needs to have have a proper structure. By definition, proper structure for double bottoms include the right side being higher than the left side and for double tops the right side must be lower than the left side. If disabled, all double top and bottom structures will be accounted for within On-Balance (Tick) Volume data regardless if proper or not. See image below:
- Default: True
Max. Offset [OBV]
How many bars back a double bottom or double top structure is allowed to be formed within On Balance Volume indicator data for the upcoming signal.
- Default: 0
Max. Width [OBV]
Over how many bars a double bottom or double top structure is allowed to form a signal on On-Balance (Tick) Volume data. Keep in mind that MOST pairs on MetaTrader offer tick volume rather than pure volume.
- Default: 14
Use WPR
Scan for double bottom and double top breakout structures within Williams %R (WPR) indicator data.
- Default: True
Strict WPR
Defines if the double bottom or double top needs to have have a proper structure. By definition, proper structure for double bottoms include the right side being higher than the left side and for double tops the right side must be lower than the left side. If disabled, all double top and bottom structures will be accounted for within Williams %R data regardless if proper or not. See image below:
- Default: True
WPR Period
The period MA used within the Williams %R indicator.
- Default: 21
Max. Offset [WPR]
How many bars back a double bottom or double top structure is allowed to be formed within Williams %R indicator data for the upcoming signal.
- Default: 0
Max. Width [WPR]
Over how many bars a double bottom or double top structure is allowed to form a signal on Williams %R data.
- Default: 14
Use MFI
Scan for double bottom and double top breakout structures within Money Flow Index (MFI) indicator data.
- Default: False
Strict MFI
Defines if the double bottom or double top needs to have have a proper structure. By definition, proper structure for double bottoms include the right side being higher than the left side and for double tops the right side must be lower than the left side. If disabled, all double top and bottom structures will be accounted for within Money Flow Index data regardless if proper or not. See image below:
- Default: True
MFI Period
The period MA used within the Money Flow Index (MFI) indicator.
- Default: 14
Max. Offset [MFI]
How many bars back a double bottom or double top structure is allowed to be formed within Money Flow Index indicator data for the upcoming signal.
- Default: 0
Max. Width [MFI]
Over how many bars a double bottom or double top structure is allowed to form a signal on Money Flow Index data.
- Default: 14
Use RSI
Scan for double bottom and double top breakout structures within Relative Strength Index (RSI) indicator data.
- Default: False
Strict RSI
Defines if the double bottom or double top needs to have have a proper structure. By definition, proper structure for double bottoms include the right side being higher than the left side and for double tops the right side must be lower than the left side. If disabled, all double top and bottom structures will be accounted for within Relative Strength Index applied price data (chosen below) regardless if proper or not. See image below:
- Default: False
RSI Period
The period MA used within the Relative Strength Index (RSI) indicator.
- Default: 14
RSI Applied Price
The price form to use when calculating price within Relative Strength Index (RSI) indicator data.
- Default: Weighted Price
- Close Price
- Open Price
- High Price
- Low Price
- Median Price
- Typical Price
Max. Offset [RSI]
How many bars back a double bottom or double top structure is allowed to be formed within Relative Strength Index (RSI) indicator data for the upcoming signal.
- Default: 0
Max. Width [RSI]
Over how many bars a double bottom or double top structure is allowed to form a signal on Relative Strength Index data.
- Default: 14
Use DMI
Scan for double bottom and double top breakout structures within Directional Movement Index (DMI) indicator data.
- Default: True
Strict DMI
Defines if the double bottom or double top needs to have have a proper structure. By definition, proper structure for double bottoms include the right side being higher than the left side and for double tops the right side must be lower than the left side. If disabled, all double top and bottom structures will be accounted for within Directional Movement Index data regardless if proper or not. See image below:
- Default: True
DMI Period
The period MA used within the Directional Movement Index (DMI) indicator.
- Default: 14
Max. Offset [DMI]
How many bars back a double bottom or double top structure is allowed to be formed within Directional Movement Index data for the upcoming signal.
- Default: 0
Max. Width [DMI]
Over how many bars a double bottom or double top structure is allowed to form a signal on Directional Movement Index data.
- Default: 14
Swing PAC Entry
Prerequisite entry condition requiring that the price respects the following Price Action Channel limits:
- Default: PAC Extrema
- PAC Mid (Close)
- PAC Opposite
- Disabled
Swing EMA Entry
Prerequisite entry condition requiring that the price respects the following EMA ribbon limits:
- Default: EMA Extrema
- EMA Mid (Close)
- EMA Opposite
- Disabled
Use Swing, Pullback & Reversal Trading System
Enables the usage of PAC and EMA Ribbons as prerequisites for entry conditions.
- Default: True
Draw PAC
- Default: True
Draw Coloured PAC Candles
- Default color: DarkGreen
PAC High/Low
The period (amount of bars) for the Price Action Channel calculation.
- Default: 10
Fractal Depth
How many candles left and right should be used to calculate. Example: if 2 is selected, from the middle candle it will scan 2 candles left and 2 candles right for a total of 5 candles. The default 2 is a classic 5-bar fractal, see image below.
- 1
- Default: 2
- 3
- 4
- 5
Draw & Use EMA Ribbons
- Default: True
Draw Support/Resistance Fractal Levels
Draws lines that represent support and resistance based off the value inputted for the “Fractal Depth” option.
- Default: True
Enable Alerts
- Default: true
Mobile Alerts
- Default: false
Mail Alerts
- Default: false
References
https://algorush.com/wiki/harmonic-patterns-indicator
https://algorush.com/trading-systems-for-metatrader/harmonic-patterns-indicator/
Start Harmonic Trading
Learn Harmonic Patterns
Recent Trading Guides
-
December 18, 2020
Harmonic Patterns Explained For Beginners
-
November 17, 2020
Trading Breakouts within Price Action & Multiple Indicators
-
October 28, 2020
Importing High Quality Tick Data on MetaTrader 4 & 5
Looking for User Guides?
Instructions for Algo Rush Expert Advisors, Indicators & Dashboards.
Trading Systems
-
From: $19.99 / month with 1 week free trial
Harmonic Pattern Dashboard
Harmonic Patterns Dashboard
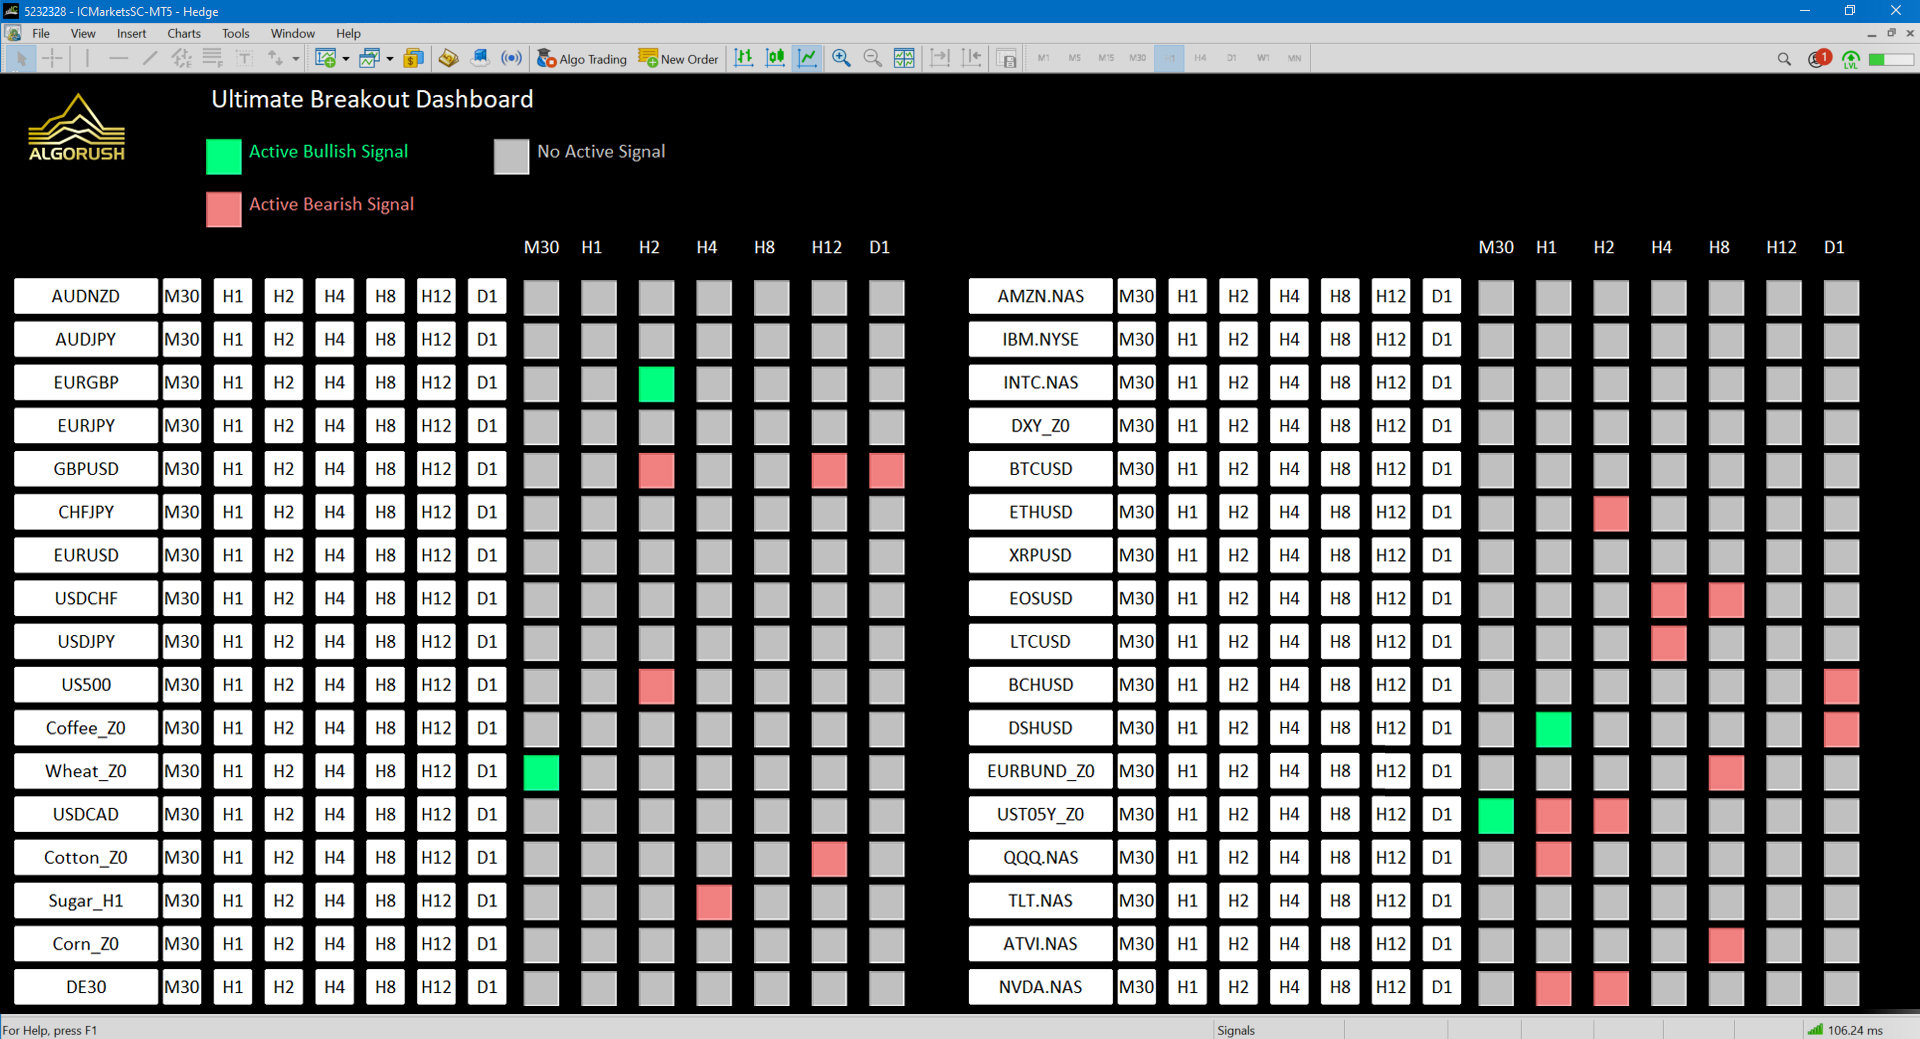
The harmonic patterns dashboard is exclusively available on MetaTrader 5 only. The harmonic pattern dashboard is capable of monitoring dozens of pairs while offering up to 21 different timeframes for each pair. When loading many pairs with all patterns enabled, please note that a PC or VPS with sufficient amounts of RAM and CPU cores will be required since this trading system is heavily math based.

Harmonic Patterns Dashboard Settings on MetaTrader 5
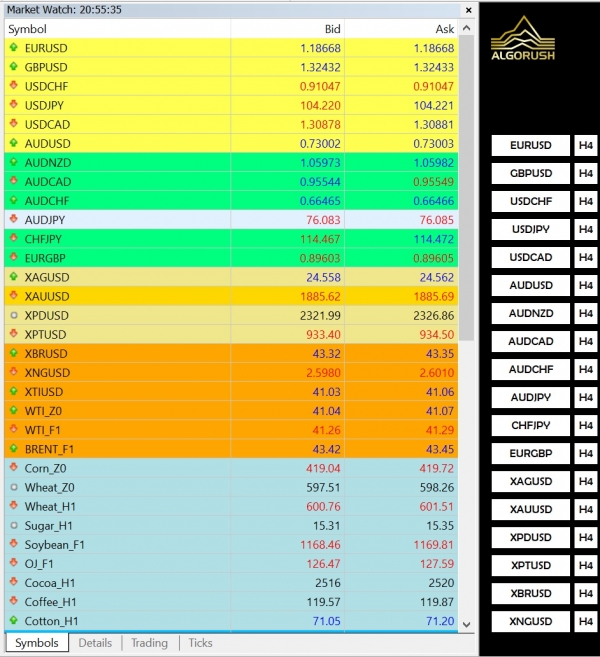
Symbols (Format=”GBPUSD,EURUSD”)
Leave this blank to have the symbols in the Market Watch window used. See image below:
- Default: (blank – uses the symbols in Market Watch instead)
- Type a pair such as GBPUSD to override fetching from the Market Watch.
- Seperate each pair with a comma only and no space.
- Example: GBPUSD,EURUSD,XAUUSD,USDCAD,BTCUSD
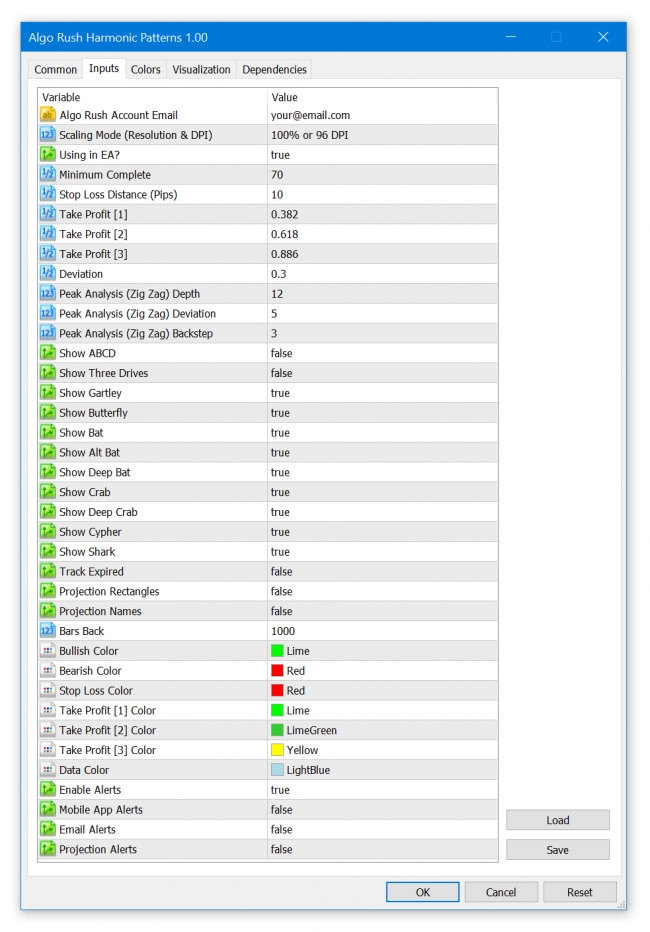
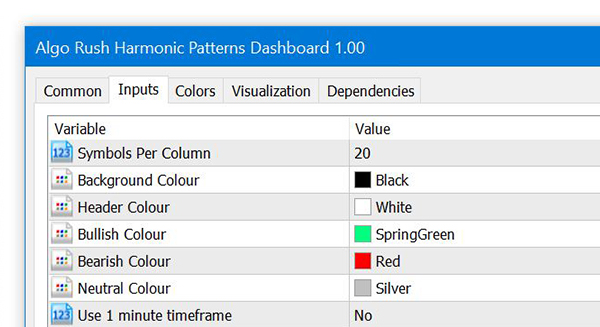
Symbols Per Column
This will define how many symbols/rows each column contains within the dashboard. Adjusting this is helpful if users either have ultra-wide or portrait orientation displays.
- Default: 20
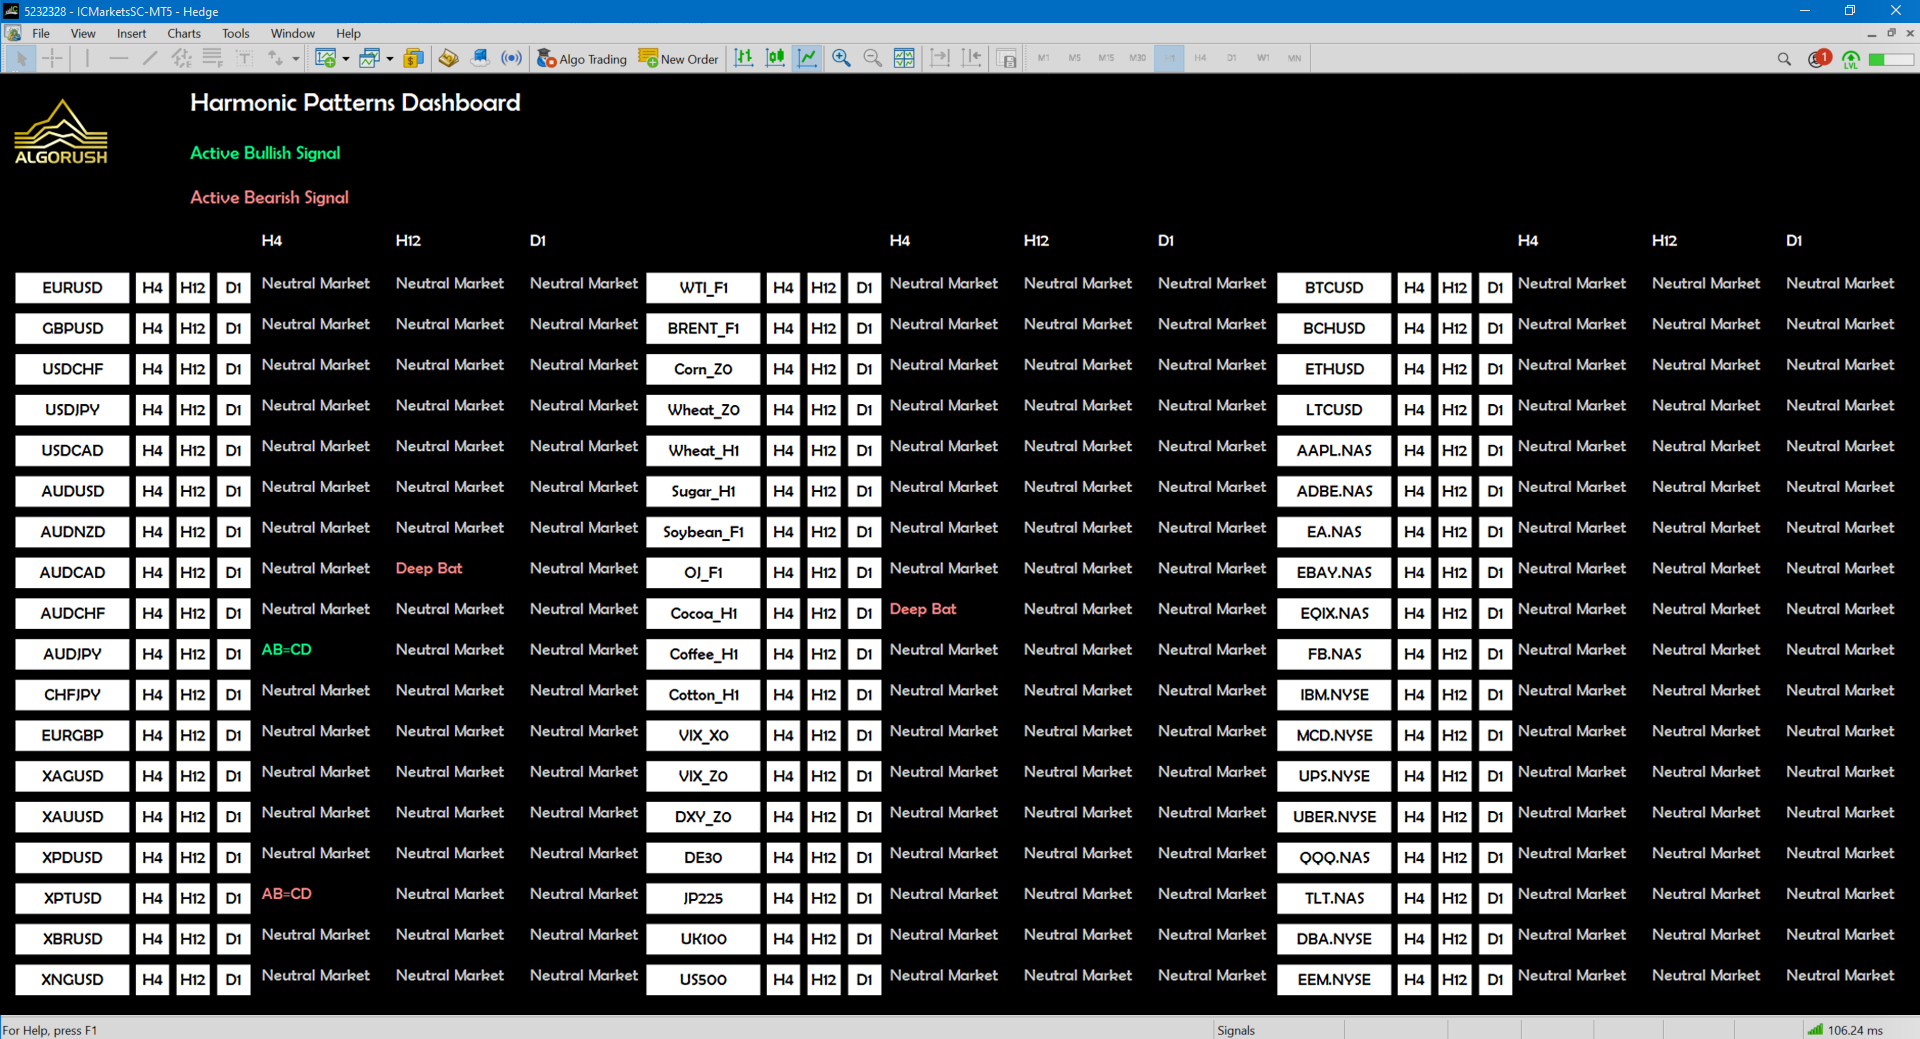
In this example, we used 18 as the value for the symbols per column since we loaded 52 pairs on 3 rows.
Background Colour
- Default: Black
Header Colour
Change only when the default background colour is changed from black to a lighter colour.
- Default: White

Bullish Colour
- Default: SpringGreen

Bearish Colour
- Default: LightCoral

Neutral Colour
- Default: Silver

Use 1 minute timeframe
- Default: No
Use 2 minute timeframe
- Default: No
Use 3 minute timeframe
- Default: No
Use 4 minute timeframe
- Default: No
Use 5 minute timeframe
- Default: No
Use 6 minute timeframe
- Default: No
Use 10 minute timeframe
- Default: No
Use 12 minute timeframe
- Default: No
Use 15 minute timeframe
- Default: No
Use 20 minute timeframe
- Default: No
Use 30 minute timeframe
- Default: No
Use 1 hour timeframe
- Default: No
Use 2 hour timeframe
- Default: No
Use 3 hour timeframe
- Default: No
Use 4 hour timeframe
- Default: Yes
Use 6 hour timeframe
- Default: No
Use 8 hour timeframe
- Default: No
Use 12 hour timeframe
- Default: Yes
Use 1 Day timeframe
- Default: Yes
Use 1 Week timeframe
- Default: No
Use 1 Month timeframe
- Default: No
References
https://algorush.com/wiki/harmonic-patterns-dashboard
https://algorush.com/trading-systems-for-metatrader/harmonic-patterns-dashboard/

Start Harmonic Trading
Learn Harmonic Patterns
Recent Trading Guides
-
December 18, 2020
Harmonic Patterns Explained For Beginners
-
November 17, 2020
Trading Breakouts within Price Action & Multiple Indicators
-
October 28, 2020
Importing High Quality Tick Data on MetaTrader 4 & 5
Looking for User Guides?
Instructions for Algo Rush Expert Advisors, Indicators & Dashboards.
Trading Systems
-
From: $19.99 / month with 1 week free trial
Harmonic Pattern Expert Advisor
Harmonic Patterns Expert Advisor (EA)
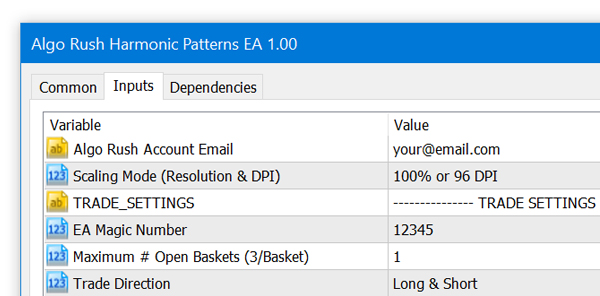
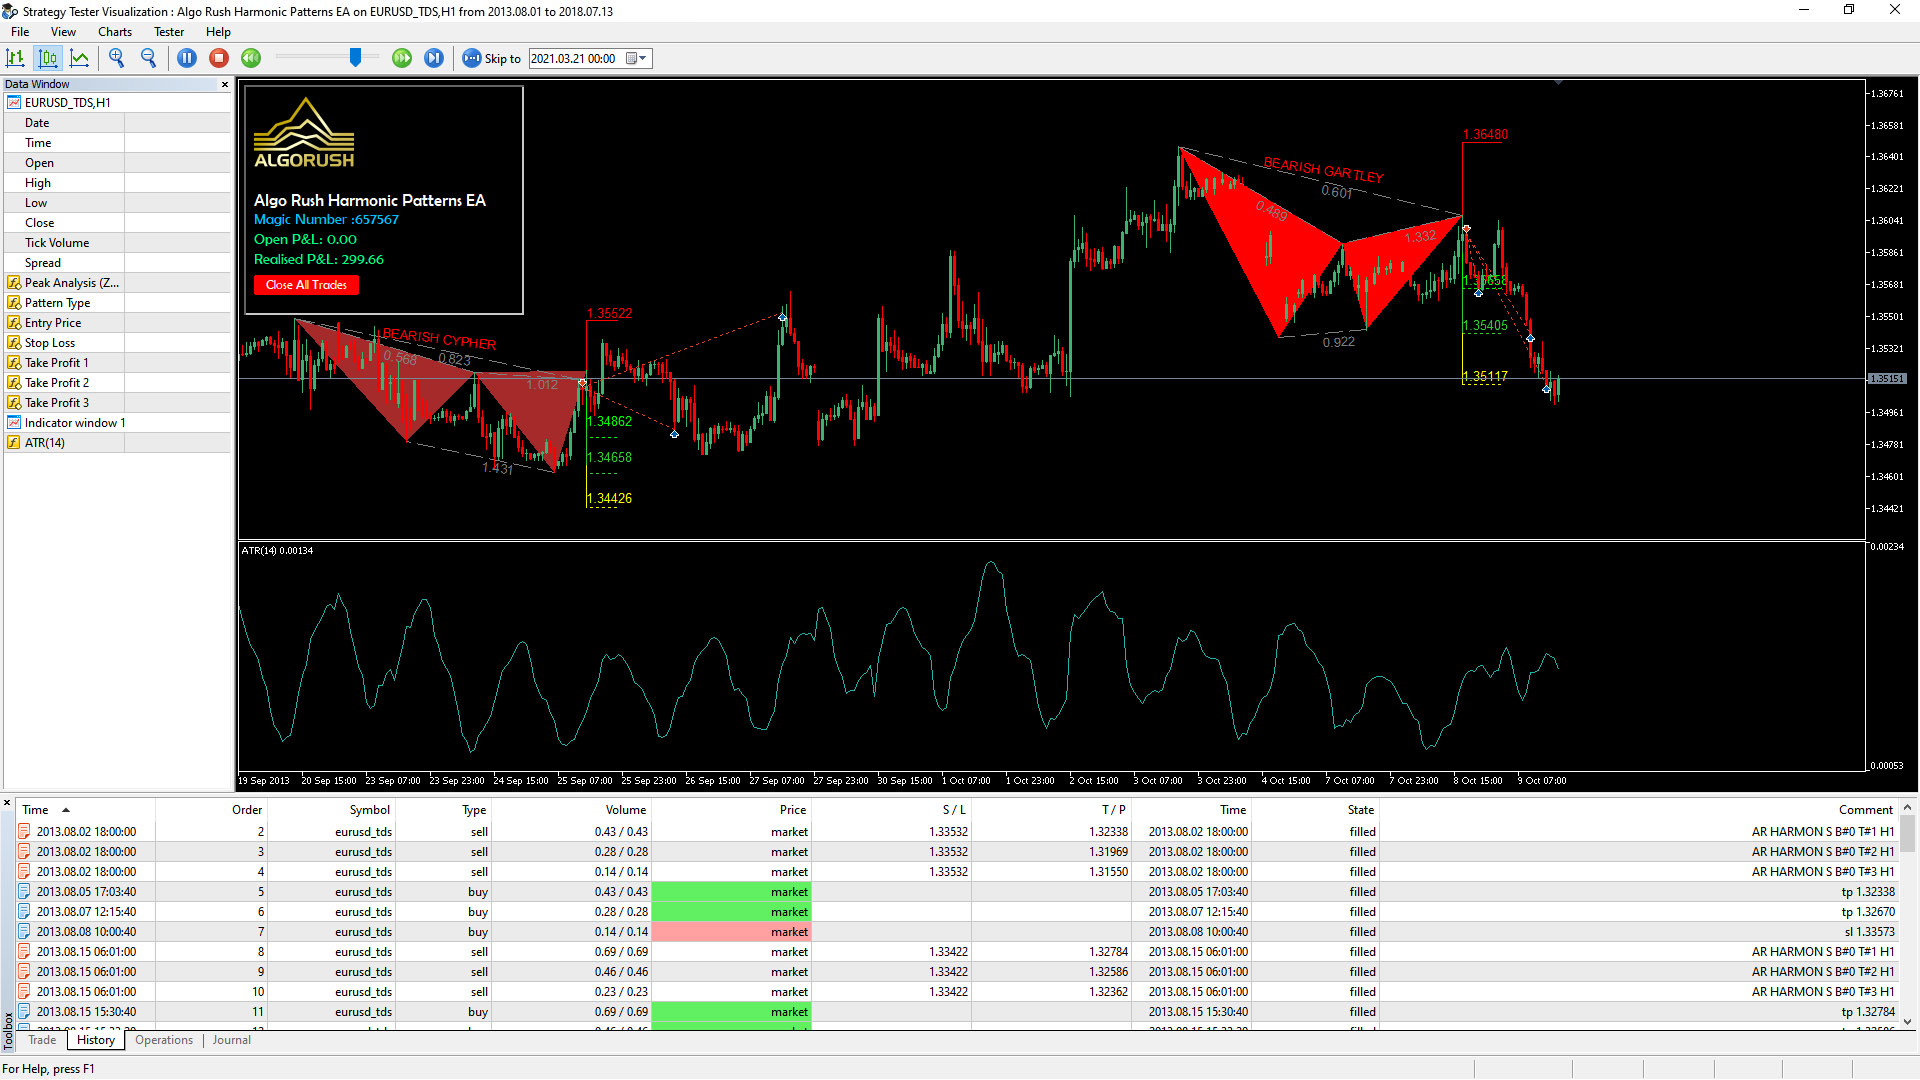
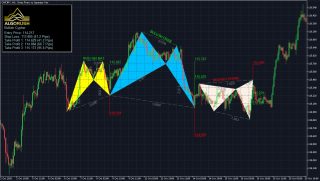
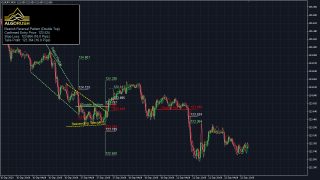
The Harmonic Patterns EA is available on MetaTrader 4 (MT4) and MetaTrader 5 (MT5). Trade over twelve harmonic patterns and use either the Potential Reversal Zone (PRZ) or the Pattern Completion Zone (PCZ) to determine key reversal and turning points.
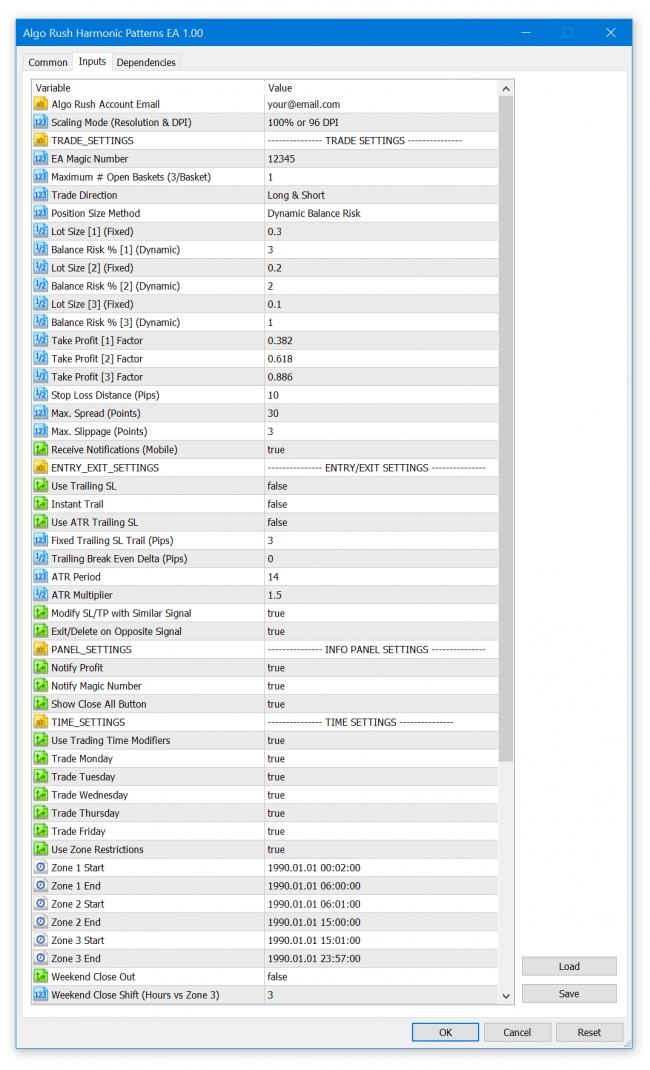
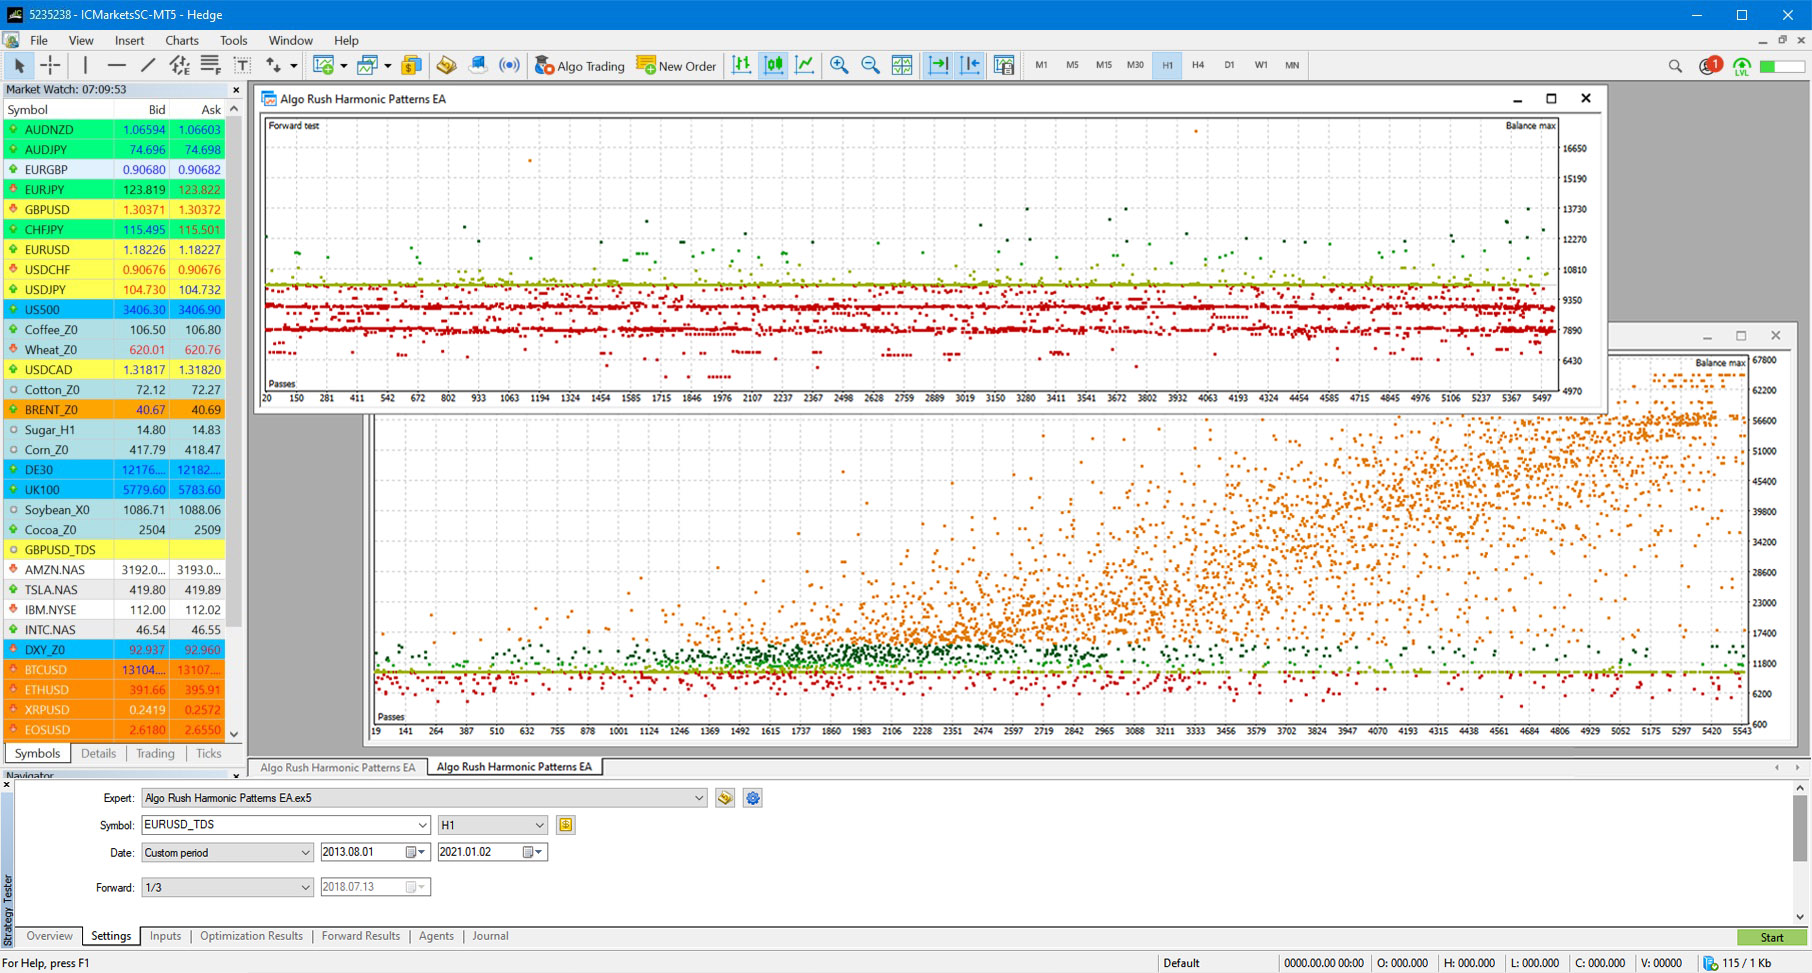
Walk-forward genetic optimizations with at least 3-5 years of sample data should be used to ensure accurate forward results. Read our article for importing tick data on MetaTrader 4 & 5 here.
One consideration to note; volume tick data provided by brokers either real-time or historically are skewed since their liquidity providers typically do not give an accurate representation of the market’s depth. Therefor we have made this system based purely off price action with no reference to tick volume within any of the trend modifiers.
Harmonic Patterns Expert Advisor (EA) Settings on MetaTrader 4 & 5
Algo Rush Account Email
The email address that the active Algo Rush subscription is under.
- Note: The indicators and Expert Advisors will not initiate without an email address linked to an active subscription.
Scaling Mode (Resolution & DPI)
Users with either resolutions above 1080p (1920×1080) or DPIs above 96 will need to adjust the scaling mode settings to an option above the default 100% value. Adjusting this will resolve any issues with displaying objects such as text, buttons and windows within active charts.
- 100% or 96 DPI (default)
- 125% or 120 DPI
- 150% or 144 DPI
- 175% or 168 DPI
- 200% or 192 DPI
- 225% or 216 DPI
- 250% or 240 DPI
EA Magic Number
This number must be unique for every EA loaded. If the users forgets to change this, there will be errors within the MetaTrader client.
- Note: Any number such as 832855
Max. # Open Baskets (3/Basket)
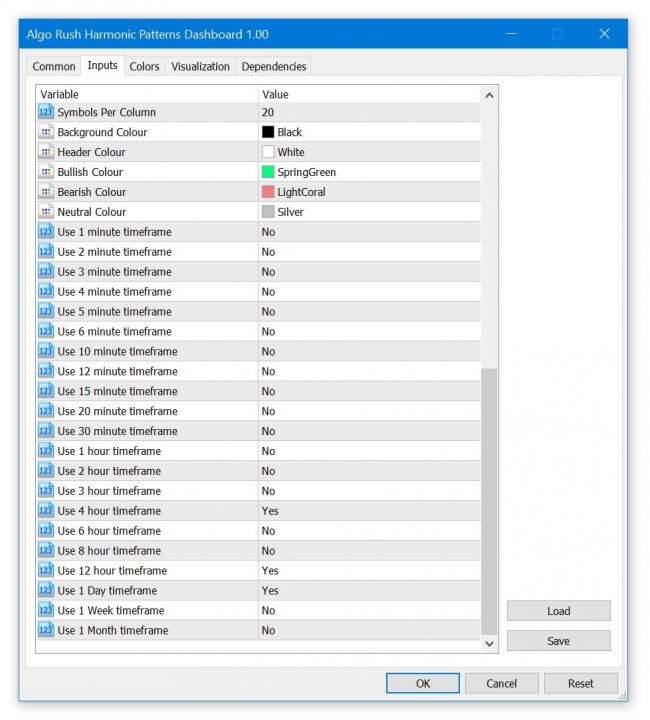
The maximum number of baskets (signals) that can be open at the same time. Within a basket each position is one of the 3 TP levels. If only two out of the three TP levels are being used, then the basket will consist of two positions that have the same entry and their own TP levels.
- Default: 1
Trade Direction
This number must be unique for every EA loaded. If the users forgets to change this, there will be errors within the MetaTrader client.
- Long & Short (Default)
- Long Only
- Short Only
Position Size Method
The method used to allocate the amount used for each lot size within one trading setup.
- Dynamic Balance Risk (default)
- Fixed
Lot Size [1] (Fixed)
- Default: 0.3
Balance Risk % [1] (Dynamic)
- Default: 3
Lot Size [2] (Fixed)
- Default: 0.2
Balance Risk % [2] (Dynamic)
- Default: 2
Lot Size [3] (Fixed)
- Default: 0.1
Balance Risk % [3] (Dynamic)
- Default: 1
TP1 Factor
It’s first multiplier with fibo range for determining First take profit level.
- Default: 0.382
TP2 Factor
It’s second multiplier with fibo range for determining second take profit level.
- Default: 0.618
TP3 Factor
It’s third multiplier with fibo range for determining third take profit level.
- Default: 0.886
Stop Loss Distance (Pips)
You can increase SL level by increasing this value, it’s simply just additional pips to stop loss fib level.
- Default: 30
Max. Spread (Points)
- Default: 30
Max. Slippage (Points)
- Default: 3
Use Trailing SL
Must be enabled for any of the trailing options to work.
- Default: false
Instant Trail
When enabled, the trailing will begin early when ATR is activated before price reaches even TP1.
- Default: false
Use ATR Trailing SL
When enabled, the trailing will begin when ATR is activated rather than after TP1 or TP2.
- Default: false
Fixed T. SL Trail (Pips)
The fixed trailing stop loss in pips that is activated at Level C (default level for level C is 0.66 on the trend fib).
- Default: 0
Trail BE Delta (Pips)
The trailing breakeven offset that could be added to account for fees when adjusting the breakeven in pips.
- Default: 0
ATR Period
- Default: 14
ATR Multiplier
- Default: 1.5
Modify SL/TP with Similar Signal
Leave enabled to have your position’s take profit and stop loss updated when a new signal in the same direction is generated.
- Default: true
Exit/Delete on Opposite Signal
Leave enabled to have your long sell when a short signal confirms and vice versa.
- Default: true
Notify Profit
- Default: true
Notify Magic Number
- Default: true
Show Close All Button
Strongly recommended to have enabled.
- Default: true
Info Panel Pixel Shift
For resolutions higher than 1080p such as 2k, 4k, etc: 5-20.
- Default: 0
Use Trading Time Modifiers
- Default: true
GMT Open Hour
- Default: 0
GMT Open Minute
- Default: 1
GMT Close Hour
- Default: 23
GMT Close Minute
- Default: 59
GMT Close Minute (Friday)
Used when “Weekend Close Out” is enabled.
- Default: 57
Weekend Close Out
The position will close out before going into the weekend. Disable this option to have keep your position in an active during weekend closes.
- Default: false
Weekend Close Shift (Hours)
If “Weekend Close Out” is enabled, the position will close out starting from the minutes defined for the Friday (weekend) close minutes. To set the offset to one hour or more before, increase this value (defined in hours).
- Default: 3
References
https://algorush.com/wiki/harmonic-patterns-expert-advisor
https://algorush.com/trading-systems-for-metatrader/harmonic-patterns-expert-advisor/

Start Harmonic Trading
Learn Harmonic Patterns
Recent Trading Guides
-
December 18, 2020
Harmonic Patterns Explained For Beginners
-
November 17, 2020
Trading Breakouts within Price Action & Multiple Indicators
-
October 28, 2020
Importing High Quality Tick Data on MetaTrader 4 & 5
Looking for User Guides?
Instructions for Algo Rush Expert Advisors, Indicators & Dashboards.
Trading Systems
-
From: $19.99 / month with 1 week free trial
- Dashboard MT4
- Dashboard MT5
- EA for MetaTrader 4
- EA for MetaTrader 5
- EA for MT4
- EA for MT5
- Expert Advisors for MetaTrader 4
- Expert Advisors for MetaTrader 5
- Expert Advisors for MT4
- Expert Advisors for MT5
- Indicator for MetaTrader 4
- Indicator for MetaTrader 5
- Indicator for MT4
- Indicator for MT5
- Indicators for MetaTrader 4
- Indicators for MetaTrader 5
- Indicators for MT4
- Indicators for MT5
- MetaTrader 4 Dashboard
- MetaTrader 4 EA
- MetaTrader 4 Expert Advisors
- MetaTrader 4 Indicator
- MetaTrader 4 Indicators
- MetaTrader 5 Dashboard
- MetaTrader 5 EA
- MetaTrader 5 Expert Advisors
- MetaTrader 5 Indicator
- MetaTrader 5 Indicators
- MT4 Dashboard
- MT4 EA
- MT4 Expert Advisors
- MT4 Indicator
- MT4 Indicators
- MT5 Dashboard
- MT5 EA
- MT5 Expert Advisors
- MT5 Indicator
- MT5 Indicators
- Scanner Dashboard MetaTrader
- Trading Indicator
- Tradingview Indicator
