What is the Pattern Completion Zone (PCZ)?
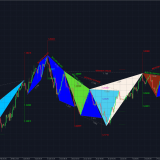
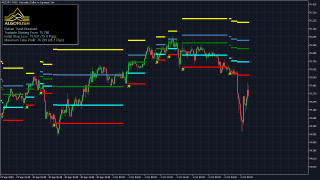
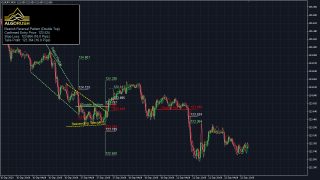
All harmonic patterns have a defined Pattern Completion Zone (PCZ) which are also known as price clusters that are formed by the completed swing (leg) at point D. The PCZ is the confluence of Fibonacci extensions, retracements and price projections for all legs within a harmonic pattern structure. Price action generally reverse within these patterns once the CD leg has been formed and confirmed. The price action’s reverse move from point D is what is known as the Pattern Completion Zone and any trades anticipated in this zone should be entered/closed based off the price reversal action levels displayed by the PCZ.
The Pattern Completion Zone (PCZ) is also referred to as the Potential Continuation Zone and is used on top of the Potential Reversal Zone (PRZ) methodology to predict future price movements from the structure’s confirmed D point instead of relying on generic Fibonacci retracement levels. The levels for the Pattern Completion Zone (PCZ) is constructed after the final point D is formed in the harmonic pattern’s structure. The levels which the PCZ produces are geared towards providing traders with potential key reversal and trend correction levels to use as maximum limits for take-profits and stoplosses.
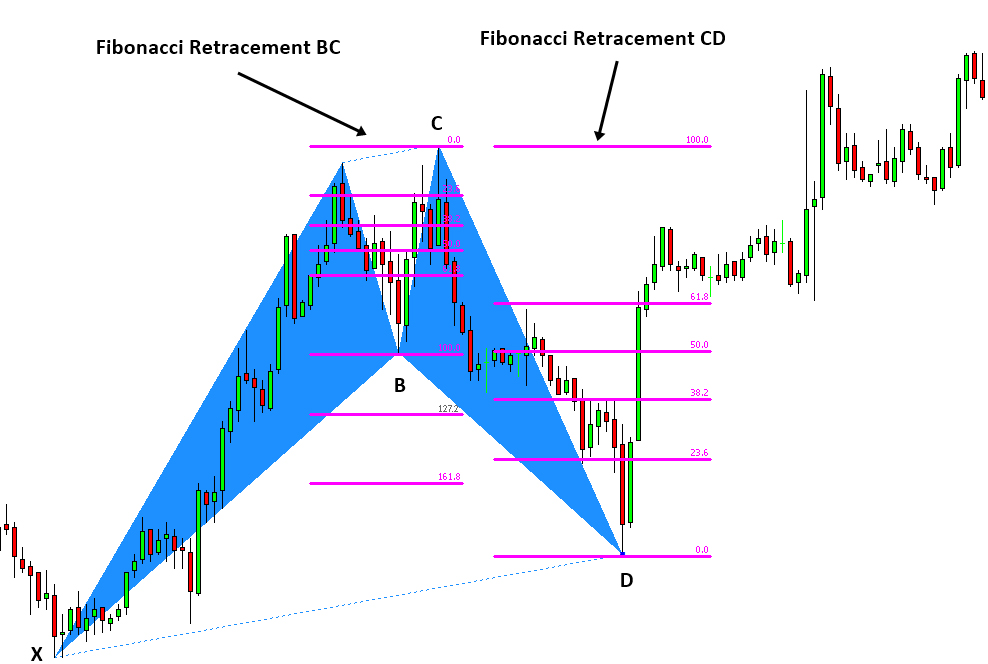
The following Fibonacci retracements are used to construct the PCZ:
-
-
- XA
- BC
- CD
- AB=CD (applicable to XABCD/4-legged patterns only)
-
The Pattern Completion Zone (PCZ) is used by traders to help determine which levels to place take-profit and stoploss orders on while the the Potential Reversal Zone (PRZ) is used in calculating an approximate range to enter once the D point (4th leg) has been confirmed.
Example 1: Potential Reversal Zone on the Cypher Pattern
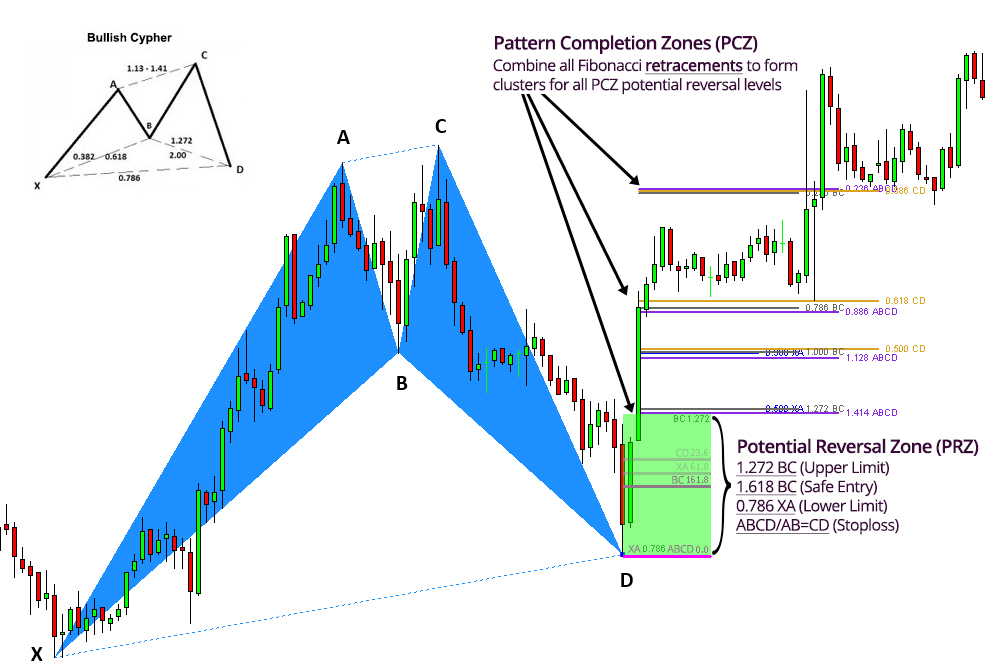
To demonstrate the PCZ, we will use a bullish Cypher to break down the retracements for each leg. Use the ratios from the diagram below when reading forward.
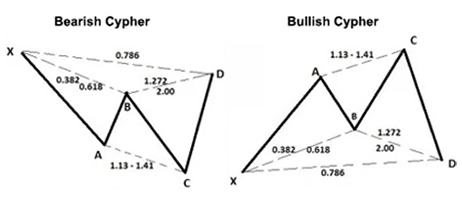
In the bullish Cypher example below, we will use the same PCZ retracement legs along with specific ratios. Some ratios within each of the legs listed below are used for the PRZ instead thus not being included in the diagram below.
Ratios used within each leg on the bullish Cypher pattern:
-
-
- XA (0.386, 0.500)
- BC (0.236, 0.786, 1.000, 1.272)
- CD (0.500, 0.618, 0.886)
- AB=CD (valid)
-

Once the Fibonacci retracements for XA, AB, BC and CD have been formed, their retracement levels (no extensions) can be combined then grouped into clusters which will help give traders a better understanding to where important levels of resistance or support may be waiting. It is also wise to set take-profit and stop loss levels on these cluster levels instead of relying on generic Fibonacci extensions (0.382, 0.618, 0.886) from point D.
Example 2: Potential Reversal Zone on the bullish Alternate Bat
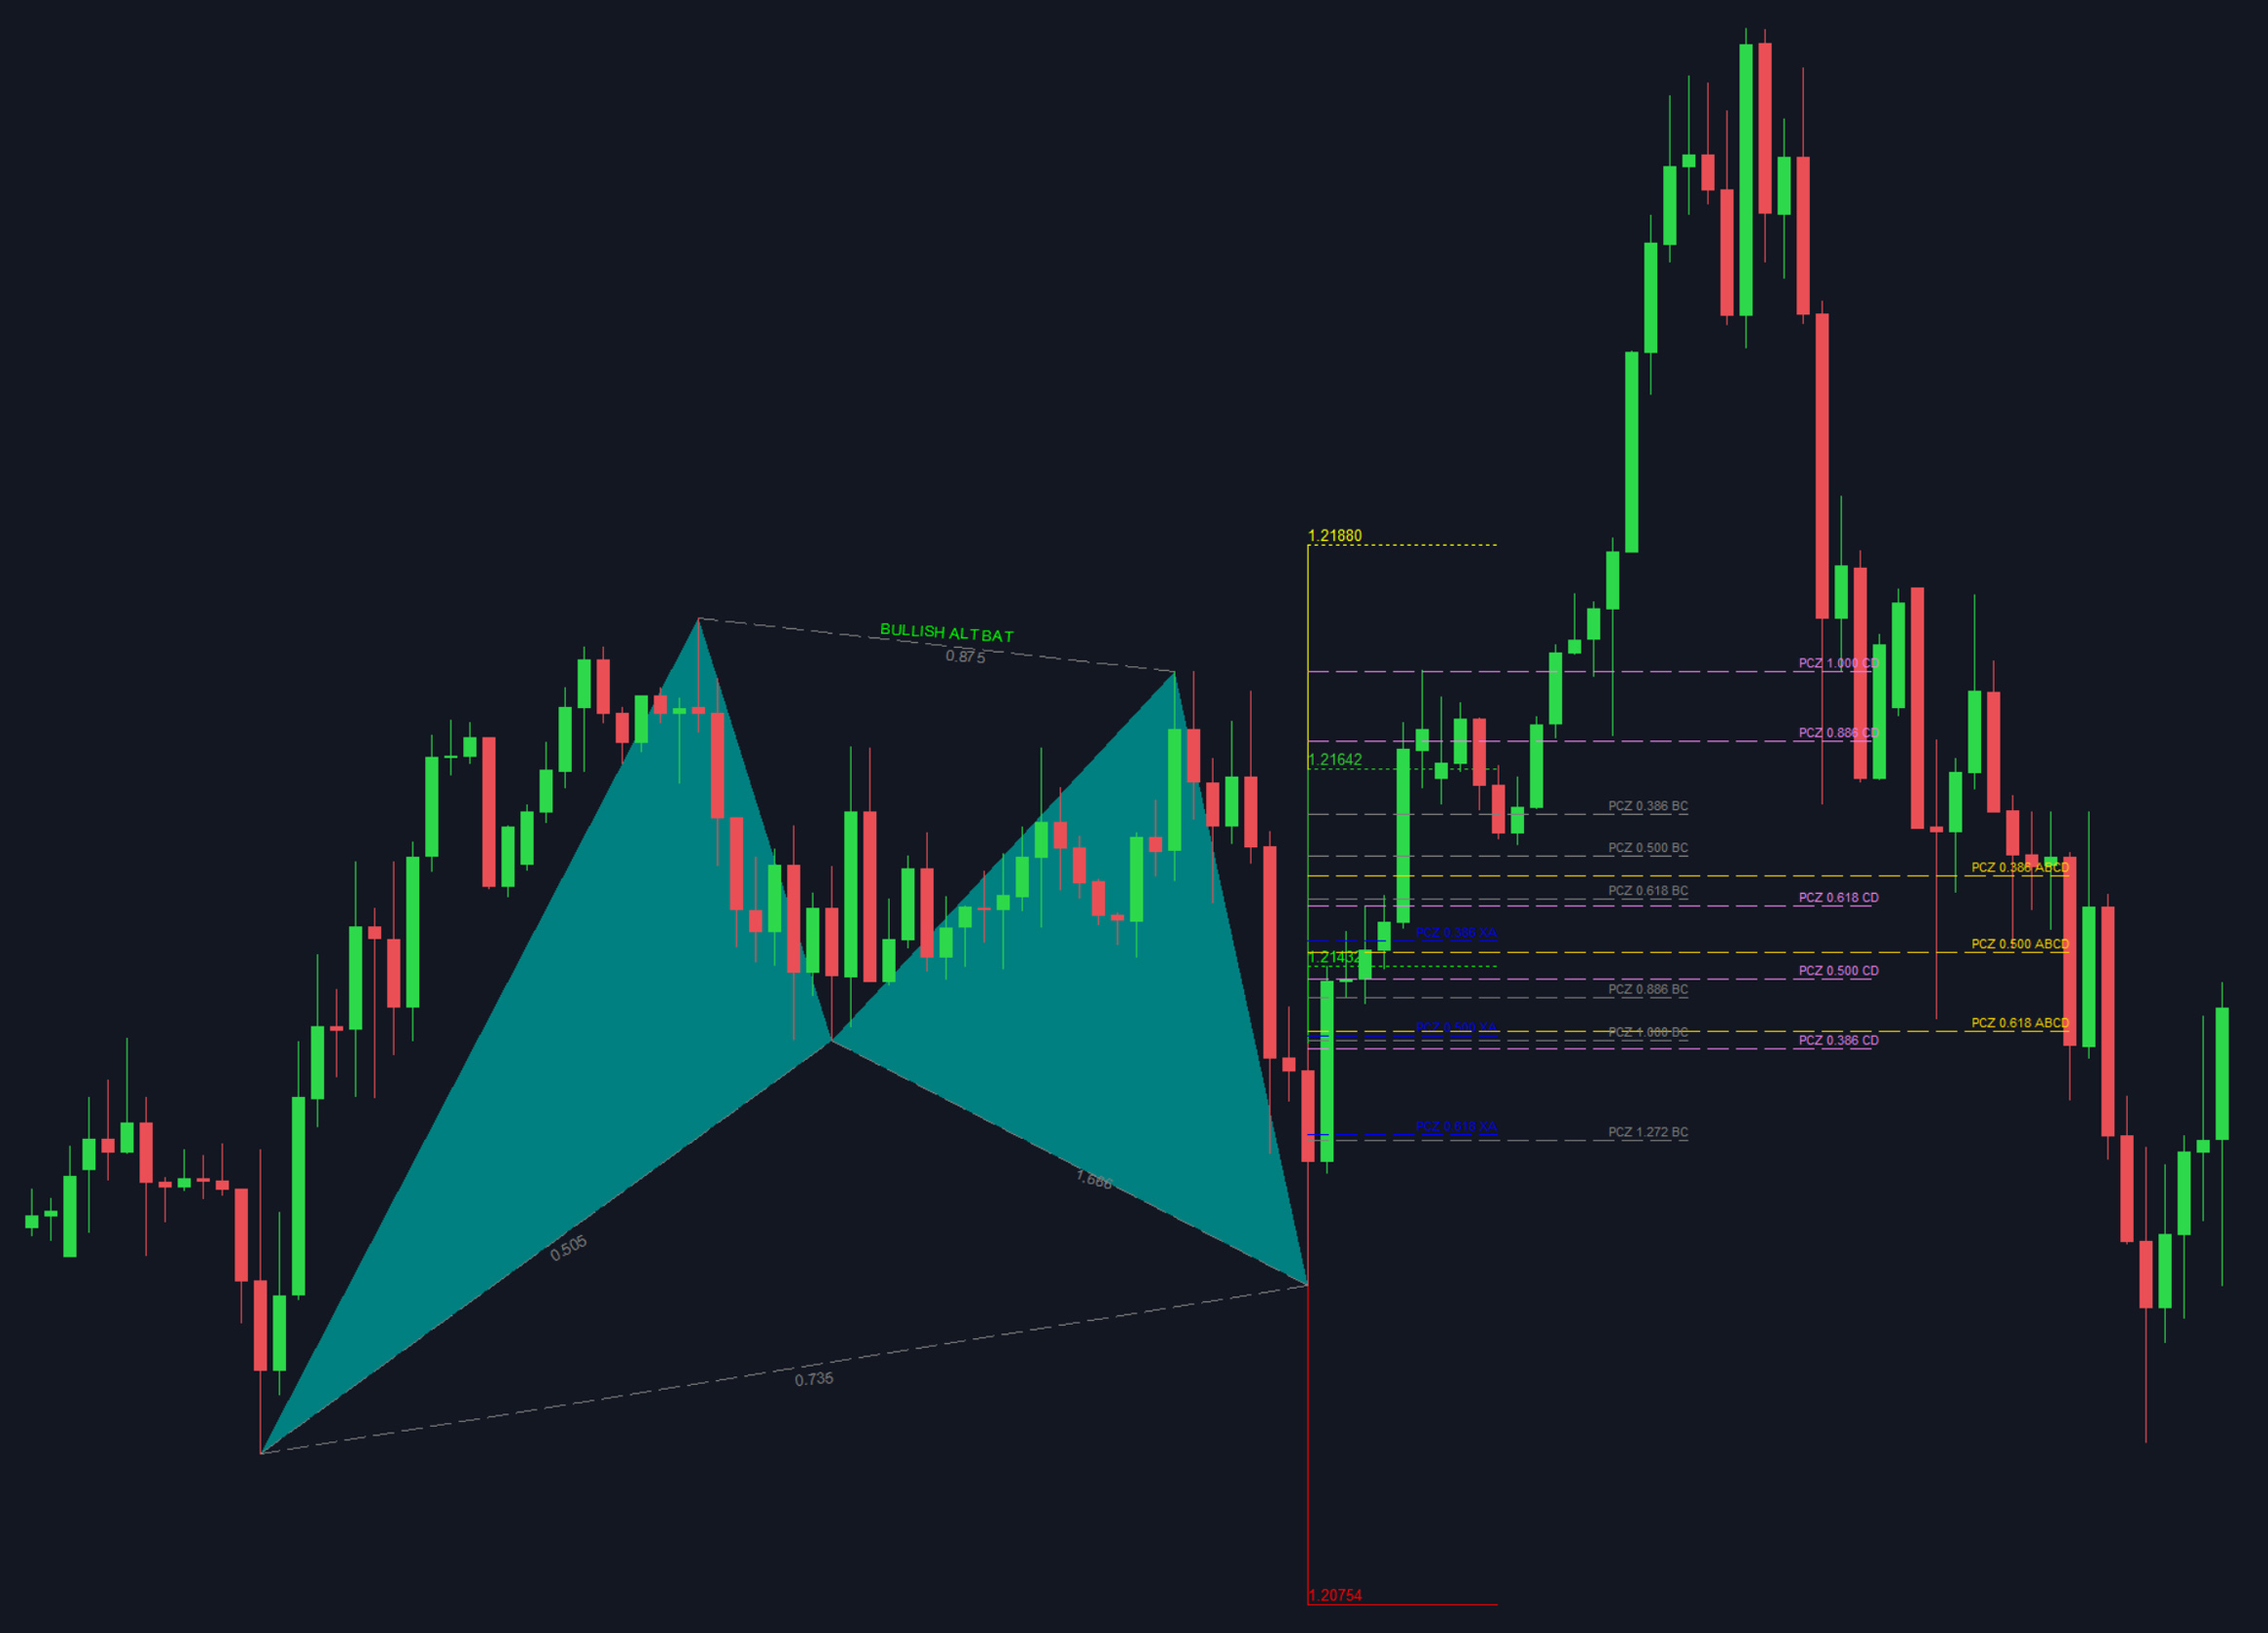
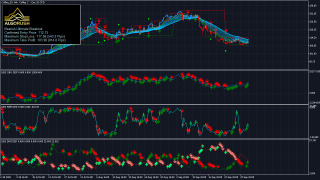
In this example we used the Alternate Bat pattern on the Harmonic Patterns Trading System. The PCZ retracement levels are projected as well the generic Fibonacci extension TP levels are also illustrated to show the difference between using clusters vs. using Fibonacci extension (0.382, 0.618, 0.886).
Note: we refrained from showing the PRZ in this example to illustrate what a projection with only PCZ levels looks like. As well consider that the lower PCZ levels are not accounted for when forming clusters.
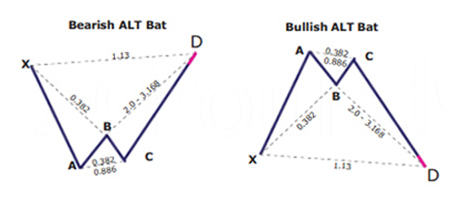
PCZ ratios used within each leg on the Alternate Bat pattern:
-
-
- XA (0.386, 0.500)
- BC (0.386, 0.618, 0.886, 1.00)
- CD (0.386, 0.500, 0.618, 0.886)
- AB=CD (0.386, 0.500, 0.618)
-
References
https://www.tradingview.com/ideas/pcz/
https://www.futuresmag.com/2016/11/29/trading-abc-patterns
https://school.stockcharts.com/doku.php?id=trading_strategies:harmonic_patterns
https://algorush.com/trading-academy/advanced-lessons/harmonic-patterns/reversal-and-turning-point-methods/pattern-completion-zone-pcz/
