XABCD Pattern
Application
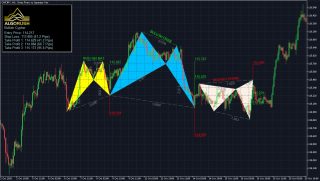
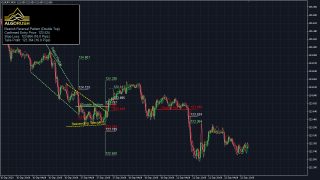
The XABCD Pattern drawing tool allows analysts to highlight various five point chart patterns. Users can manually draw and maneuver the five separate points (XABCD). The XABCD points create four separate legs, which combine to form chart patterns. The four legs are referred to as XA, AB, BC, and CD.
Each of the five points (XABCD) represent a significant high or low in terms of price on the chart. Therefore, the four previously mentioned legs (XA, AB, BC, CD) represent different trends or price movements which move in opposite directions.
As a result, there are four major XABCD chart patterns that are most common. These patterns can be either bullish or bearish.
The four major patterns include:
- Gartley.
- Butterfly.
- Crab.
- Bat.
Gartley
For this example we will examine a Bullish Gartley Pattern:
- The pattern begins with an uptrend designated as XA.
- Price reverses back down at A and stops at B. The Fibonacci Retracement ration of AB should be 61.8% of the price range of A minus X.
- Price reverses at B. The BC retracement should be between 61.8% and 78.6% of the AB price range (not the length of the lines). This is shown along the line AC.
- At C, price reverses with retracement CD between 127% and 161.8% of the range BC. This is shown along the line BD.
- Price D is the point to enter the market (buy).
Butterfly
For this example we will examine a Bullish Butterfly Pattern:
- The swing from A to D should be a 127.2% or 161.8% extension of the XA line.
- Within the A to D swing, a valid ABCD pattern must be observed.
- In an ideal setup, the two triangles (XAB and BCD) should be almost equal in terms of time. If not look for the second triangle (BCD) to be between 61.8% and 161.8% of the first triangle (XAB).
- A move beyond 161.8% would suggest that the bullish pattern is broken and bearish movement may be inevitable.
Crab
- AB should be the 0.382 or 0.618 retracement of the XA line.
- BC should be either the 0.382 or 0.886 retracement of the AB line.
- CD is the 2.24 or 9.64 extension of the BC line.
Bat
- AB is the 0.382 or 0.500 retracement of the XA line.
- BC is the 0.382 or 0.886 retracement of the AB line.
- CD can be either the 1.618 or 2.618 extension of the BC line.
Chart patterns provide so many smart ways of applying harmonic patterns in your chart. Some of them are fully automated approaches and some of them are semi-automated approaches. One of them is using the XABCD harmonic chart pattern.
- The XABCD harmonic is a group of reversal patterns.
- It’s a 4-legged pattern and has several variants (Gartley, Butterfly, Crab, Bat).
- Each variant has its specific fibonacci ratios
What is the XABCD pattern?
Created by Harold McKinley Gartley, XABCD harmonic pattern drawing tool makes it possible for analysts to highlight various five point chart patterns. Users can draw and maneuver the five separate points (XABCD) manually. The XABCD points make four distinct legs that come together to form chart patterns. The four legs are known as XA, AB, BC, and CD.
Each of the five points (XABCD) show an important low or high in terms of price on the chart. Thus, the four previously mentioned legs (XA, AB, BC, CD) represent different trends or price movements which move in opposite directions.
Due to this, there are four major XABCD chart patterns that are most popular. They can be either bearish or bullish. The four main patterns include Gartley, Butterfly, Crab and Bat.
The Gartley pattern
Gartley forms when the action of price has been happening for an uptrend or downtrend, but has started showing indications of correction. The pattern is made up of ABCD pattern bearish or bullish, but preceded by a point (X) which are above the point D. Gartley pattern has the these qualities:
- AB movement should be 61.8 percent retracement of XA
- BC movement has to be 38.2 percent or 88.6 percent retracement of AB
- If BC 38.2 percent retracement occurs, CD has to move 127.2 percent of BC. Thus, if BC is 88.6 percent, the CD should be expanded 161.8 percent of BC
- CD movement has to be 78.6 percent retracement of XA

The Butterfly pattern
Made by Bryce Gilmore, the butterfly pattern is perfect is defined as the 78.6 percent Fibonacci retracement AB of XA . This pattern contains special qualities such as:
- The length of AB has to be 78.6 percent retracement of XA
- The length of BC might be 38.2 percent or 88.6 percent retracement move from AB
- If BC moves 38.2 percent retracement of AB, then CD should be 161.8 percent of BC. Thus, if BC is 88.6 percent going from AB, then CD has to be expanded 261.8 percent of BC
- CD has to either be 127 percent or 161.8 percent of XA

The Crab pattern
Scott Carney in 2000 strongly believed in the harmonic pattern, and created the crab. He stated that this is the most accurate patterns among all harmonic patterns as potential reversal zone extreme way of movement XA.
The crab pattern has a high risk/reward ratio, because you can put a very tight stop-loss position. The pattern should have the following characteristics:
- The length of AB has to either be 38.2 percent or 61.8 percent retracement of the XA
- The length of BC might be 38.2 percent or 88.6 percent retracement of the length AB
- If the length of BC is 38.2 percent retracement of AB, CD has to be 224 percent of BC. Therefore, if the length of BC is 88.6 percent of the length of AB, then the length of the CD will be 361.8 percent of BC
- CD has to be 161.8 percent of the length of XA

The Bat pattern
Scott Carney found another harmonic pattern in 2001 called bat. The bat is characterized from the 88.6 percent Fibonacci retracement of the movement XA as potential reversal zone. Bat pattern has these qualities:
- The length of AB has to be 38.2 percent or 50.0 percent retracement of XA
- BC can either be 38.2 percent or 88.6 percent retracement of the AB
- If retracement BC 38.2 percent of AB, then CD has to be 161.8 percent of BC. Therefore, if the BC 88.6 percent moving from AB, then CD has to be 261.8 percent of BC
- CD must be 88.6 percent retracement of XA

What does the XABCD pattern tell traders?
The XABCD harmonic pattern can be grouped into retracement, extensions and x-point patterns. Locating them can be tricky if doing it on your own and it can take a long time because there are approximately 11 ratios in every pattern to be measured. Rather, some traders do it automatically with some tools available. The pattern also work with audio alerts and other alerting systems so you don’t have to waste your time trying to locate them, but rather, just carrying out your analysis.
How to use the XABCD Pattern?
XABCD harmonic pattern falls into the category of the retracement patterns, all having a D point that does not go beyond the X point of a pattern. They will have a D point (where a price reversal is preferred) close to the B point. Different retracement XABCD harmonic patterns can be used in ranges or channels, so, you have to be sure to know which one to apply in which situation.
Biggest mistakes to avoid with the XABCD pattern
These patterns operate based on human emotions and there isn’t one time frame that performs better than another. That is likely because we are mapping out patterns of human emotions and the traders that are reacting to particular events react the same way if it is a shorter term move, or a longer term move.
There are a few factors that come into play with the decision making process based off larger vs. smaller time frames, but this can be easily adaptable once you decide what to look for.
Since XABCD patterns act based on human emotions, it would only make sense to take time into account to get a more consistent harmonic pattern structure.
Have it in mind that if you want to make adjustments you need to ensure all the most consistent patterns possible. By doing this, you can see more clearly the impacts that your changes have on the results pushing forward.
Pros & Cons of using these patterns
One advantage of using this pattern is that it offers more consistency with price and time. Traders often look for is consistency within the patterns and how you identify that consistency is necessary. Fibonacci time measurements play a crucial role in XABCD harmonic patterns.
Drawing any harmonic patterns needs the identification of the impulse leg, it’s the foundation of all harmonic patterns. But if you were to pull up any chart, you can see that the market is made up of several impulse legs.
To select the right one, the decision is entirely up to you. A possible solution would be to choose the impulse leg that coincides with a structure resistance or support. Usually, the more confluence you have, the higher the probability of your trade.
Conclusion
If you think about trading as a business and not a hobby, then you should have a plan for everything. You do not want to make decisions which are subjective as it will influence your thought process.
Just as it is with any other trading strategies, whether harmonic trading, price action trading, or trend following, there are pros and cons to it. As a trader, you have to know the pitfalls of your trading approach and apply proper risk management. It is best to use most of these patterns in combination with other trade reading strategies to guarantee the best results.
Key takeaways:
- The 5-0 pattern is a reversal harmonic pattern.
- It follows specific fibonacci ratios (which you can read more below)
The patterns are relatively new but are getting more popular lately. It stands out from the other harmonic patterns because it is meant to begin a new trend rather than discover retracement. There are two types of this pattern, bullish and bearish.
The convergence zones discovered with the help of the shark pattern makes it possible for us to accurately detect the rebound but doesn’t necessarily lead to the restoration of the previous trend. On the other hand, regular rollbacks aim to determine the ability of the forces dominant on the market in the previous period (bears or bulls) to get the initiative back to their disposal. If they are not sufficient, the last reversal of the previous trend occurs, but already within another pattern – 5-0 harmonic pattern.
How to identify the 5-0 pattern?
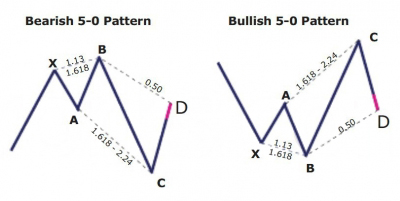
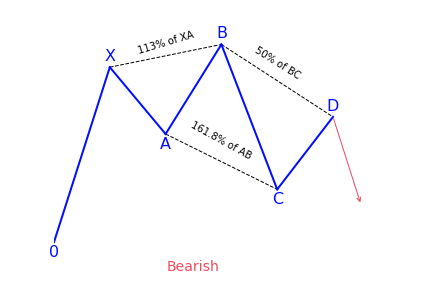
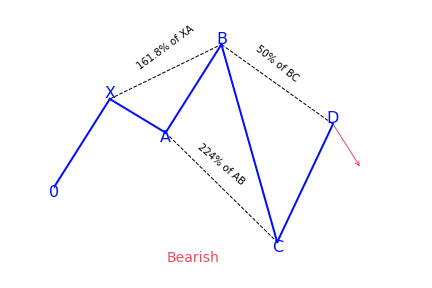
The 5-0 pattern begins with either an uptrend or a downtrend which gets exhausted and draws zigzag like corrective movements. The qualities of the 5-0 pattern to look at include:
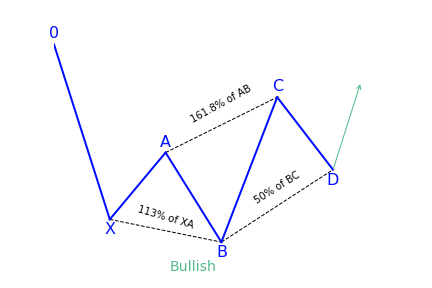
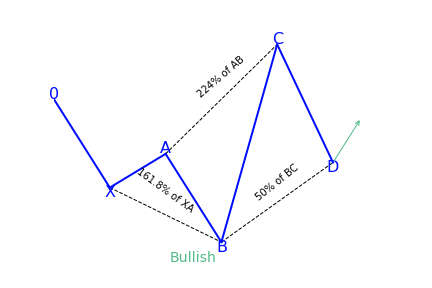
- AB movement has to be 1.13 to 1.618 retracement of XA.
- BC movement has to be 1.618 to 2.24 retracement of an AB.
- CD movement ought to be 0.5 retracements of BC
- C should be between 0.886 and 1.13 of 0X movement
If the conditions are satisfied, some traders trade the last leg of CD. They entering at C with a stop below 2.24 of AB retracement and aiming at 50 percent correction of BC movement.
The 5-0 harmonic pattern is traded when the price is getting to point D. The stop-loss is positioned a few ticks below/above the farthest possible D level. Unlike a lot of the other patterns, 5-0 doesn’t have specific targets because it usually begins a new trend. Here the pattern fib ratios don’t matter much. Entries might be done with a limit order or on price reversals away from point D. All entries have to be confirmed for risk/reward ratio. Entries having less risk/reward have to be taken cautiously or discarded altogether.
A reliable indicator should automatically scan for, recognize, display, and alert emerging 5-0 and other harmonic chart patterns. It indicates the name of the pattern, when it happened, and the stop price. The pattern scanner goes through various charts in the same period and assists traders to find trading opportunities as soon as they come up.
Bearish 5-0 pattern
To correctly identify the bearish 5-0 pattern, first, find the shark pattern, wait for the implementation of its targets at 88.6 or 113 percent, and the following rollback in the direction of 50 percent of the BC wave. The length of this wave in both graphic configurations is 161.8 to 224 percent of AB. If after the convergence zones of the shark pattern is reached, a correction in the direction of 23.6 percent, 38.2 percent, or 50 percent has followed, we can talk about the transformation of the real pattern into 5-0.
Bullish 5-0 pattern
After the target at 113 percent of the shark harmonic pattern was achieved, it was followed by a rollback in the direction of 38.2 percent of the CD wave. The trader has to search for this place for confirmation signals to create a long position. It can be both indicators, prompts from price action, or other items and techniques used for technical analysis.
What does the 5-0 pattern tell traders?
The 5-0 harmonic chart pattern suggests a long entry upon completion of the pattern or confirmation of the D point of the pattern. The pattern is a unique 5-point reversal structure that typically shows the first pullback of an important trend reversal. It is a relatively new pattern that has 4 legs and particular Fibonacci measurements of each point within the structure, creating room for better flexible interpretation. The Potential Reversal Zone (PRZ) is described differently from other harmonic chart patterns.
Conservative traders look for more confirmation before getting into a trade. Targets for this pattern can be placed at the discretion of the trader as the reversal point could be the beginning of a new trend. Common stop-loss levels are found behind a structure level beyond the D point or the next vital level for the Fibonacci sequence.
How to trade when you see the 5-0 pattern?
One of the best processes of interpreting this pattern is to look at it from a tired and frustrated trader’s point of view. Taking the bullish 5-0 pattern as an example, then we can see why. The AB leg ends with B below X, making a lower low. We then get a longer move in time where the BC leg is the most prolonged move with C ending over A.
The movement from B to C may look like a bear flag or bearish pennant. C to D indicates intense shorting pressure and a belief among bears that new lows are on the way. Rather, we get to D – the 50 percent retracement of BC. Rather than new lower lows, we get a confirmation swing forming a higher low. That move will most probably create a brand new trend reversal or significant corrective move.
The elements of trading the 5-0 pattern
- The pattern starts (with 0) at the beginning of a long price move
- After 0 has formed, an impulse reversal at X, A, and B should have a 113 to 161.8 percent extension
- The projection off of AB has a 161.8 percent extension requirement to C. C can extend beyond the 161.8 percent extension but not beyond 224 percent.
- D is the 50 percent retracement of BC and is same as AB
- The reciprocal AB=CD is needed
Drawing the 5-0 pattern properly
To perfectly draw or locate a 5-0 harmonic chart pattern on the price chart, first of all, we need to locate the X and A points of the pattern. The X point is seen at the bottom of a strong bearish trend. The A point is found at the top of a bullish trend. The next thing traders need to do is to draw a Fibonacci retracement tool from X to A to determine the B point of the chart pattern. The B point should be within the 113 percent to 161.8 percent Fibonacci retracement of XA.
In the last step, we will get the entry point, D point, of the 5-0 harmonic chart pattern. To get the D point of the pattern, draw a Fibonacci retracement tool from B to C. The D point has to be at the 50 percent Fibonacci retracement of BC.
Traders can be sure when the D point of the pattern is confirmed. The stop-loss for the order should be set at the lower support level. The profit target for the order should be placed within the 50 to 88.6 percent Fibonacci retracement of CD.
The C axis can also be traded, if it is the D point of a bearish harmonic chart pattern. The B point can be traded if the entries are confirmed by the other tools for technical analysis.
References
https://patternswizard.com/5-0-harmonic-pattern/
https://harmonictrader.com/harmonic-patterns/5-0/
https://www.liteforex.com/blog/for-beginners/5-0-pattern-shark-hunt/
https://www.orbex.com/blog/en/2017/03/catch-key-reversals-5-0-pattern
https://algorush.com/trading-academy/advanced-lessons/harmonic-patterns/harmonic-trading-101/how-to-trade-harmonic-patterns/
