This is an old revision of the document!
Ultimate Breakout System
The Ultimate Breakout System uses four different underlying trend modifiers to determine the direction of the market. Breakouts are generated within price data and five various indicators within uptrend and downtrend conditions. The Expert Advisor (EA), indicator and dashboard are available for MetaTrader 4 & 5. The system works seamlessly with Forex, commodities, indices, equities, cryptocurrencies and more. Trading breakouts within existing technical analysis setups providers traders with additional support for pinpointing positions of entries along with their targets.
System Overview
The Ultimate Breakout Setup is given the name it deserves due to the tremendous amount of trading styles it comes equipped with. This setup can be broken down into two main parts with several indicators and trading styles.
Part 1: Swing, Pullback & Reversal Trading (M15 timeframe recommended)
- EMA lines, ribbons and channels
- Price Action Channel (PAC)
- Fractals and fractal levels
- Pivot points (HH, LH, LL, HL)
Part 2: Reversal Breakout & Trend Trading (D1, 4H, 1H, M30 & M15 timeframes recommended)
- Detects double bottoms and double tops within
- Price Candles (close or low/high)
- Williams %R (WPR)
- On Balance Volume (OBV)
- Relative Strength Index (RSI)
- Money Flow Index (MFI)
- DMI (DI+ and DI- only, ADX is used in part 3)
Part 3: Trend Identification & Safety Exit Measures
- Double Adaptive ATR-ADX
- Price Action Channel (PAC) Cross
- EMA Ribbon Cross
- Fractals
The Expert Advisor (EA), overlay indicator and multi-pair and multi-timeframe dashboard are available for MetaTrader 4 & 5. The system works seamlessly with Forex, commodities, indices, equities, cryptocurrency and more.
Trend modifying indicators such as Fractal pivots, Double Adaptive ATR-ADX, PAC and EMAs are all used in conjunction with one another for finding structures in order to fine tune the most ideal positions for entries. We guarantee that no components in this indicator and EA will repaint. For more explanation on this visit this setup's EA page.
*For more details on input configurations visit the indicator and EA pages of this setup.
Part 1: Swing, Pullback & Reversal Trading
The tools incorporates the majority of the indicators needed to analyse and scalp Trends for Swings, Pullbacks and reversals on M15 charts and M1 charts.
Note: If you are using this portion of the setup, we strongly recommend the M15 timeframe. Other timeframes can be used however the inputs used to calculate the indicators have been optimized for the M15 timeframe.
Incorporated within this portion of tool are the following indicators:
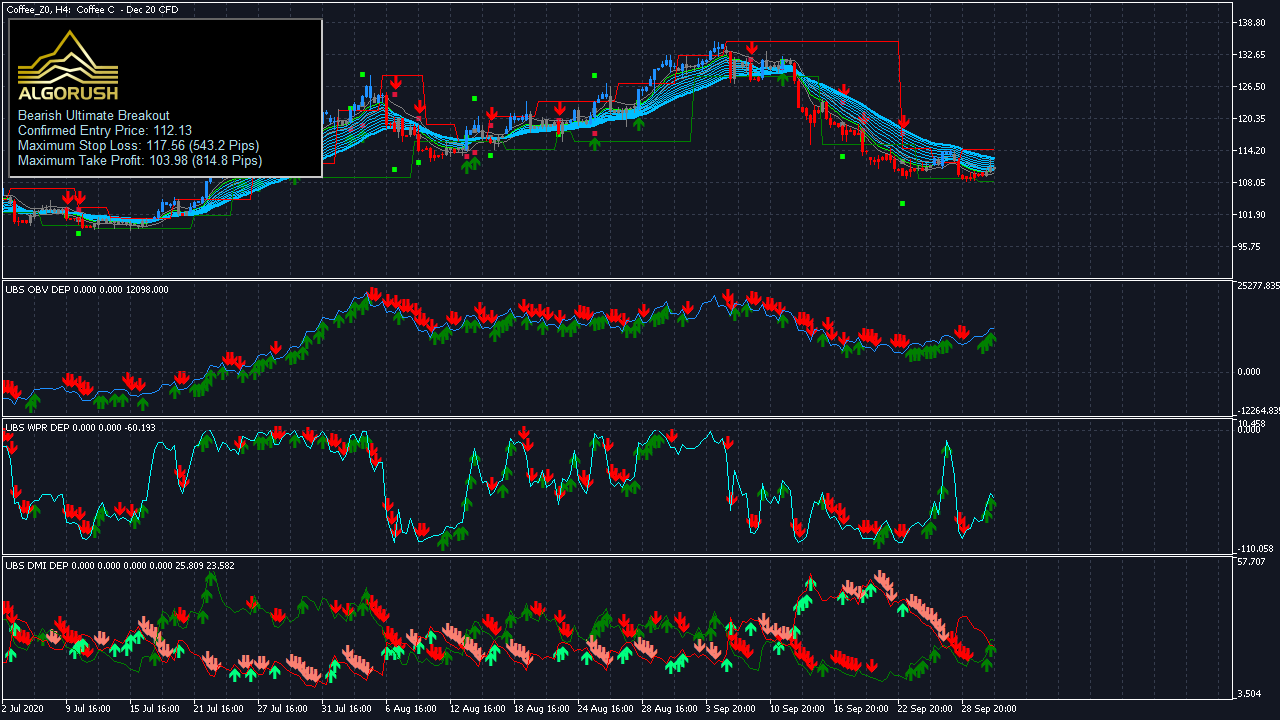
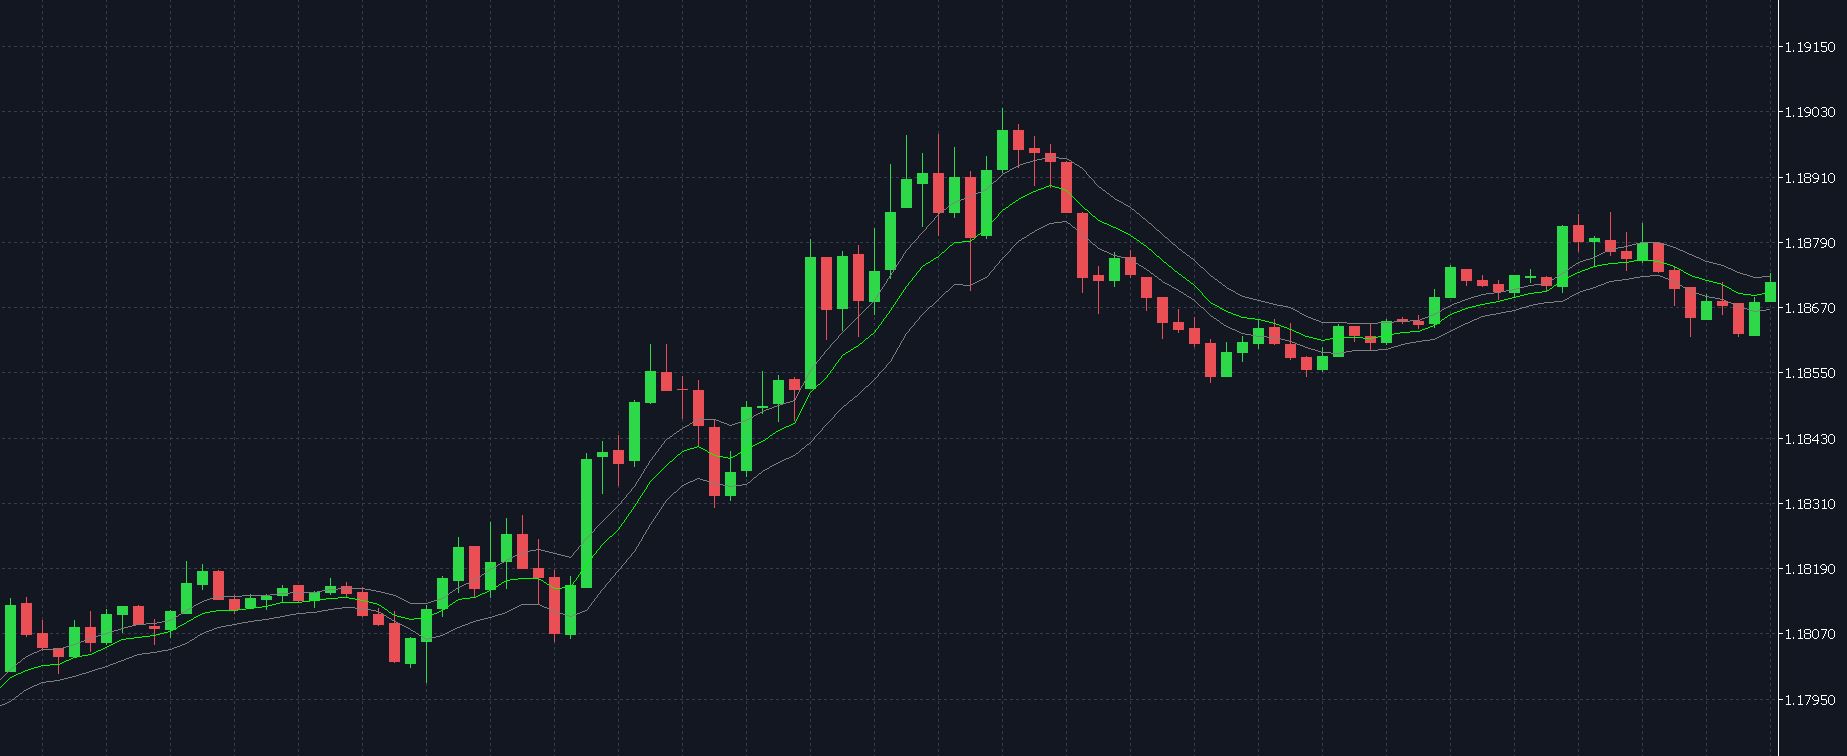
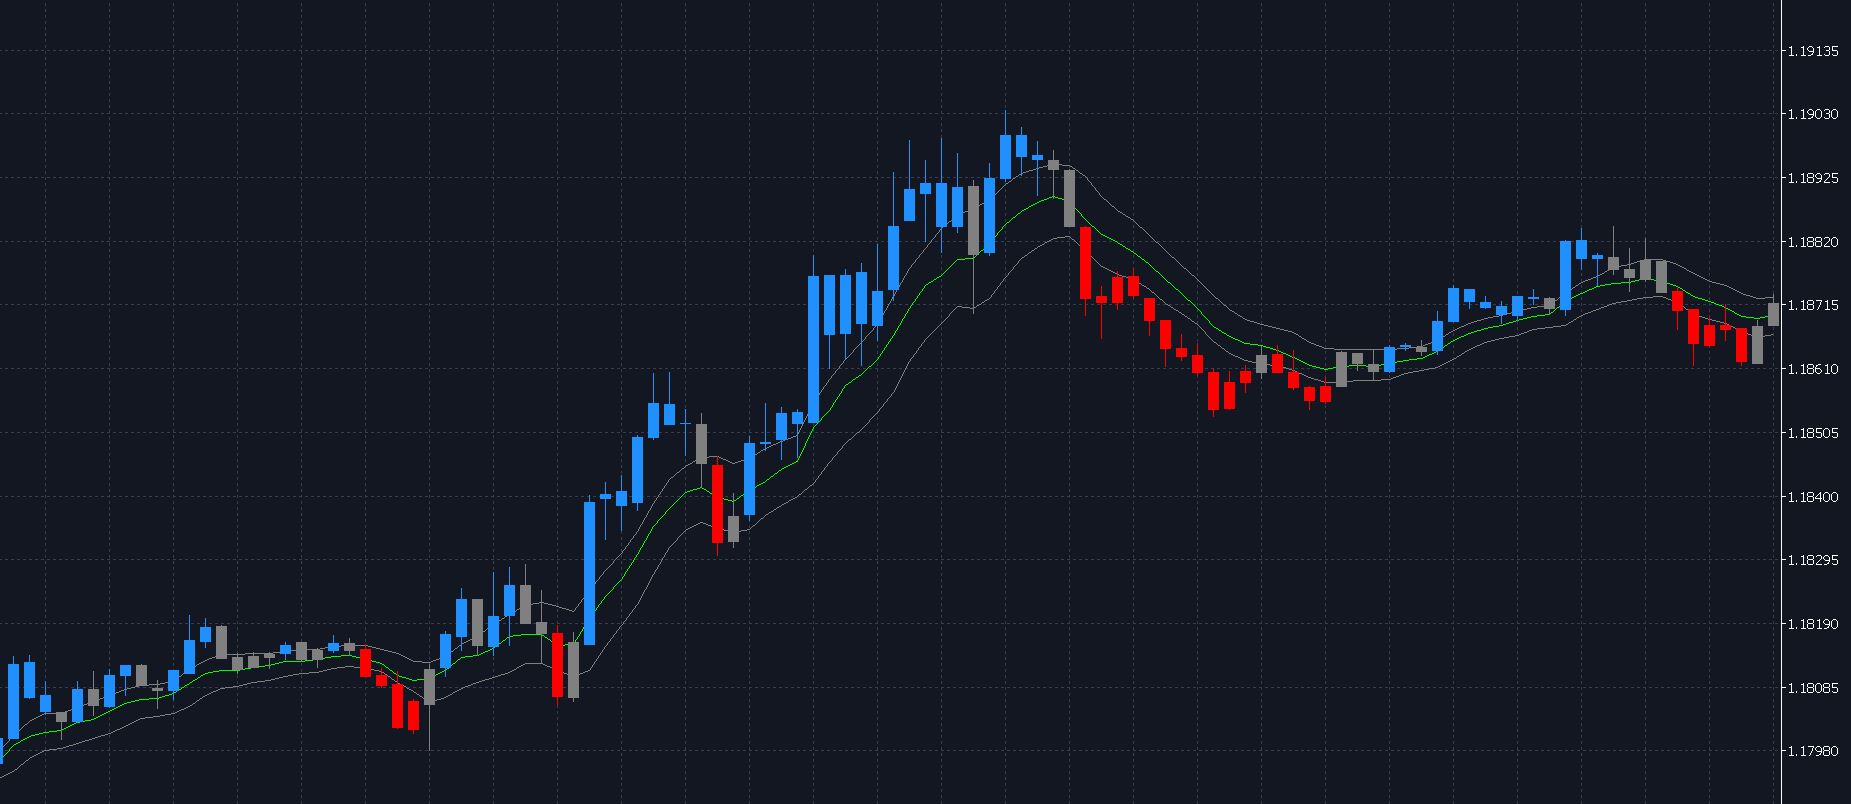
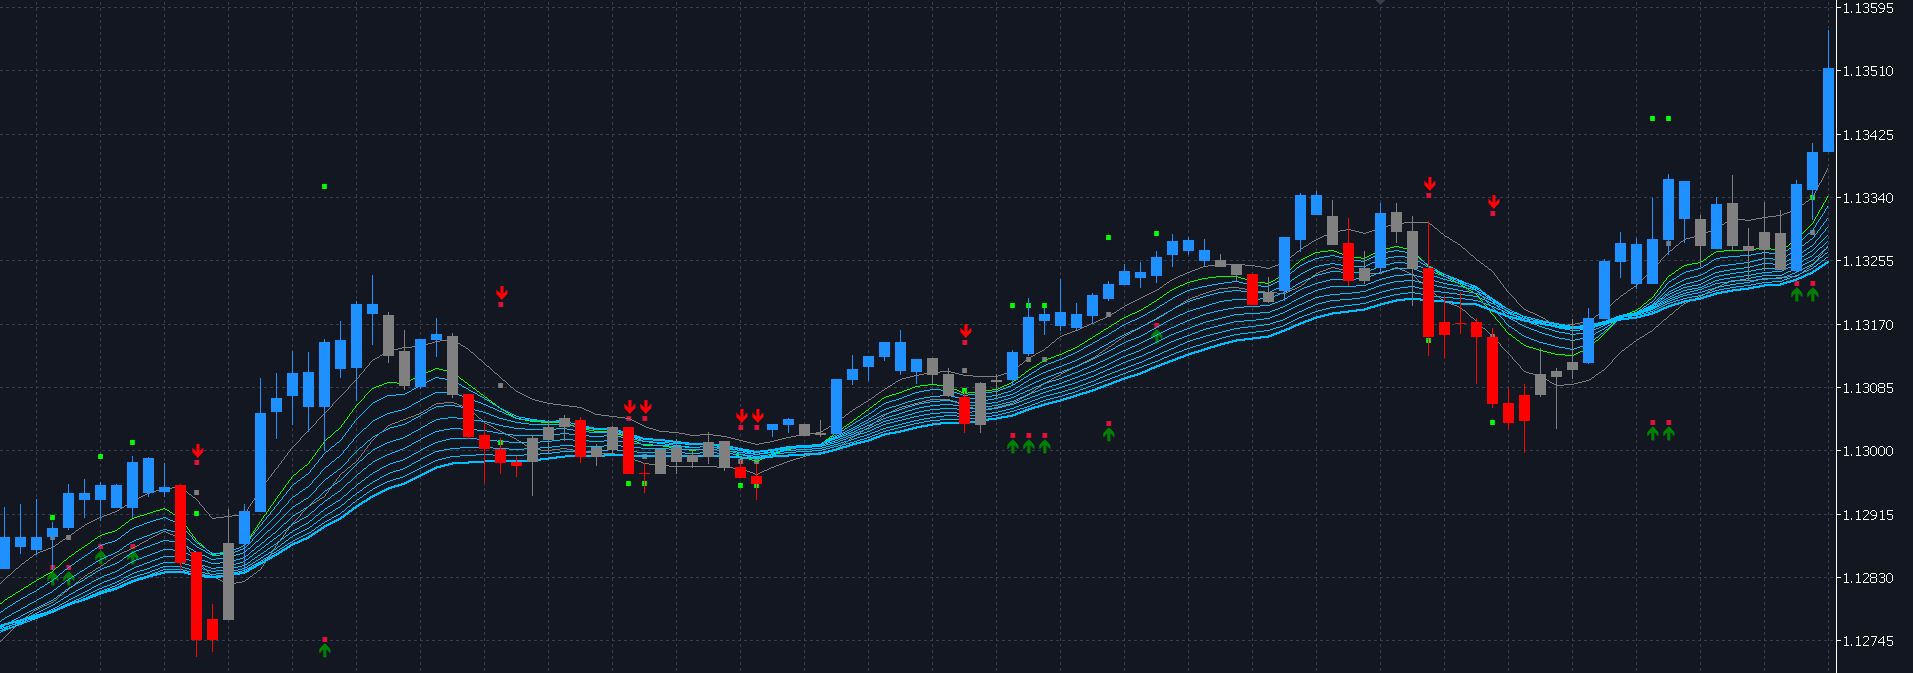
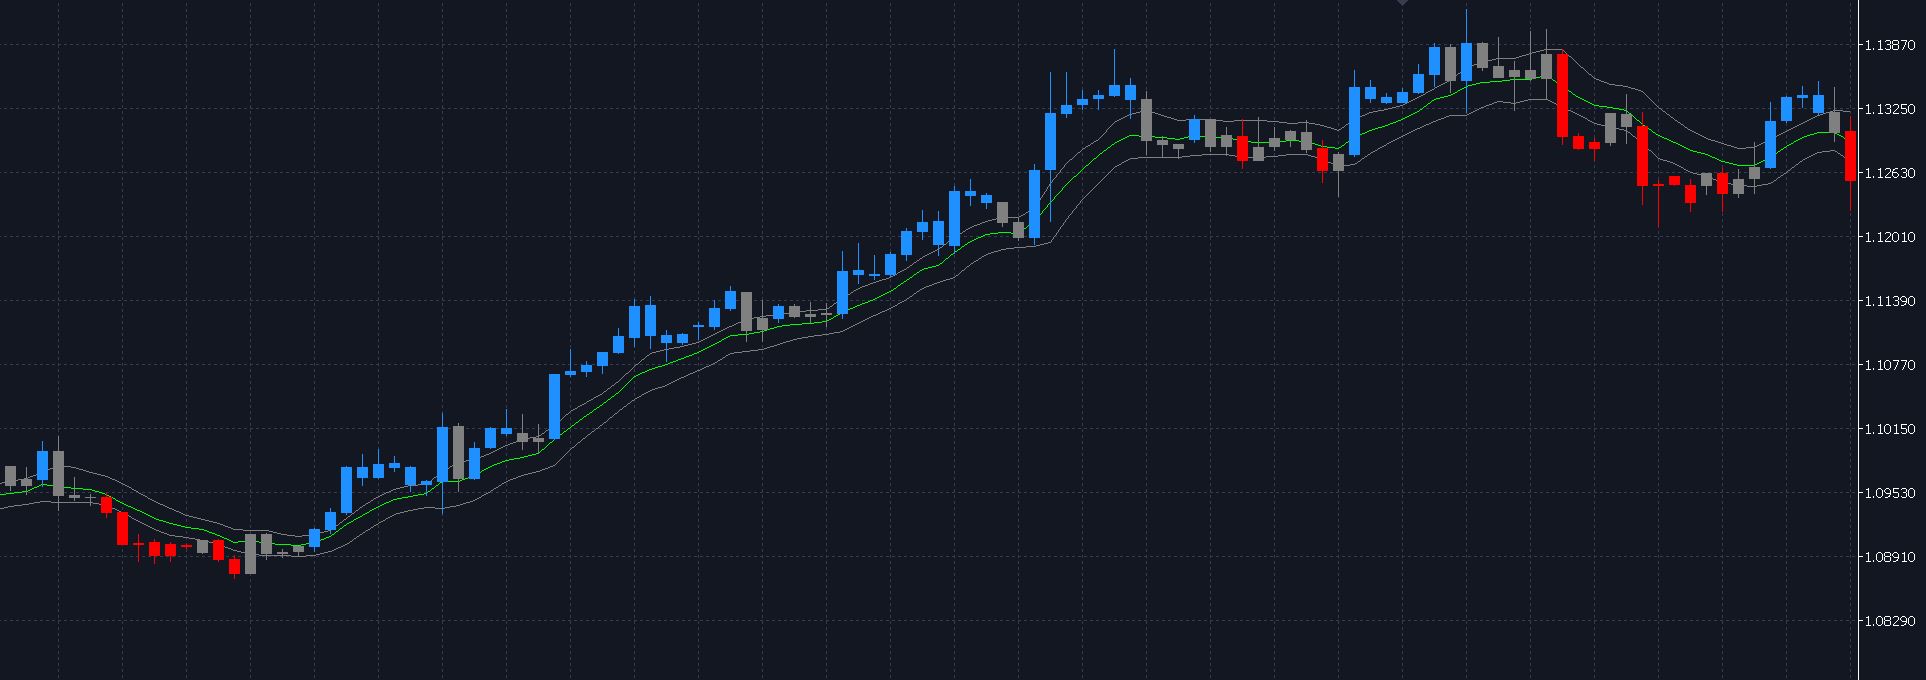
- The 10EMA (default) High/Low + Close Price Action Channel (PAC)
- The PAC channel display and functionalities are enabled by default.
- Coloured coded Bar high lighting based on the PAC (enabled by default):
- Blue = bar closed above PAC
- Red = bar closed below PAC
- Gray = bar closed inside PAC
- Lime (middle line) = EMA10 of bar close
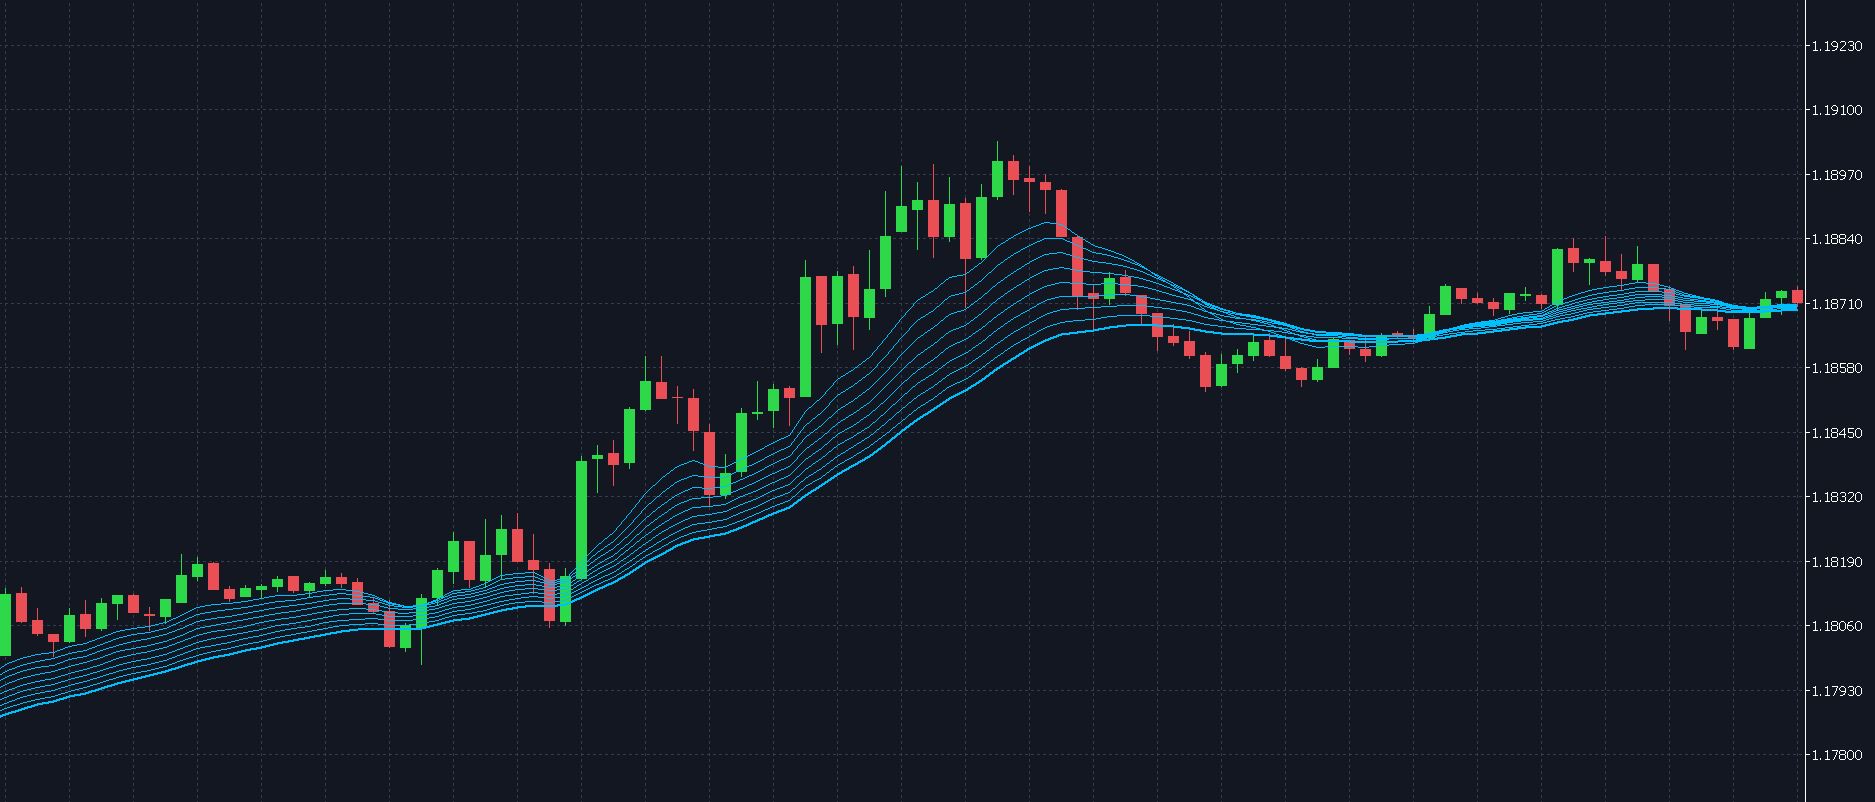
- EMA12-36 Ribbon is displayed by default
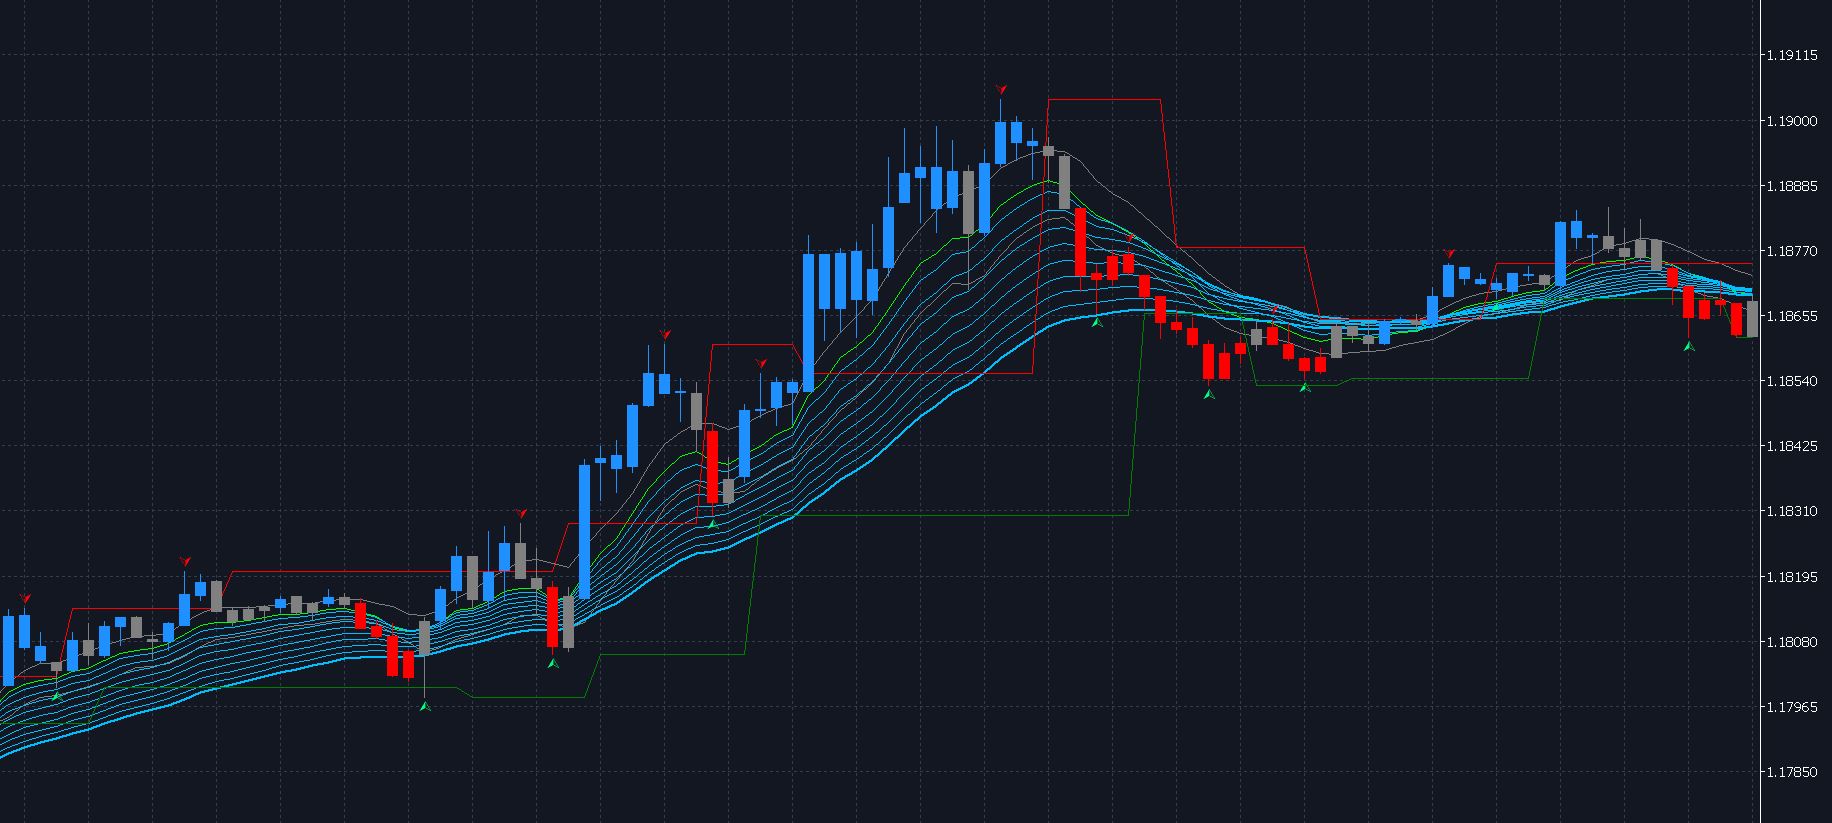
- Optional Display Fractals and Resistance/Support (disabled by default)
- The support and resistance lines are drawn on the close of the 2nd candle. This is only under the condition that the Fractal Depth is set to 2 (since it will scan for 2 candles both left and right from the centre (3rd) candle. For example if the Fractal Depth option is set to 4, then the support or resistance band that are drawn from the fractal pivots will be drawn starting from the close of the 4th candle. It is ideal to stick to the default option which will incorporate the classical 5 bar bull and bear fractal requirements.
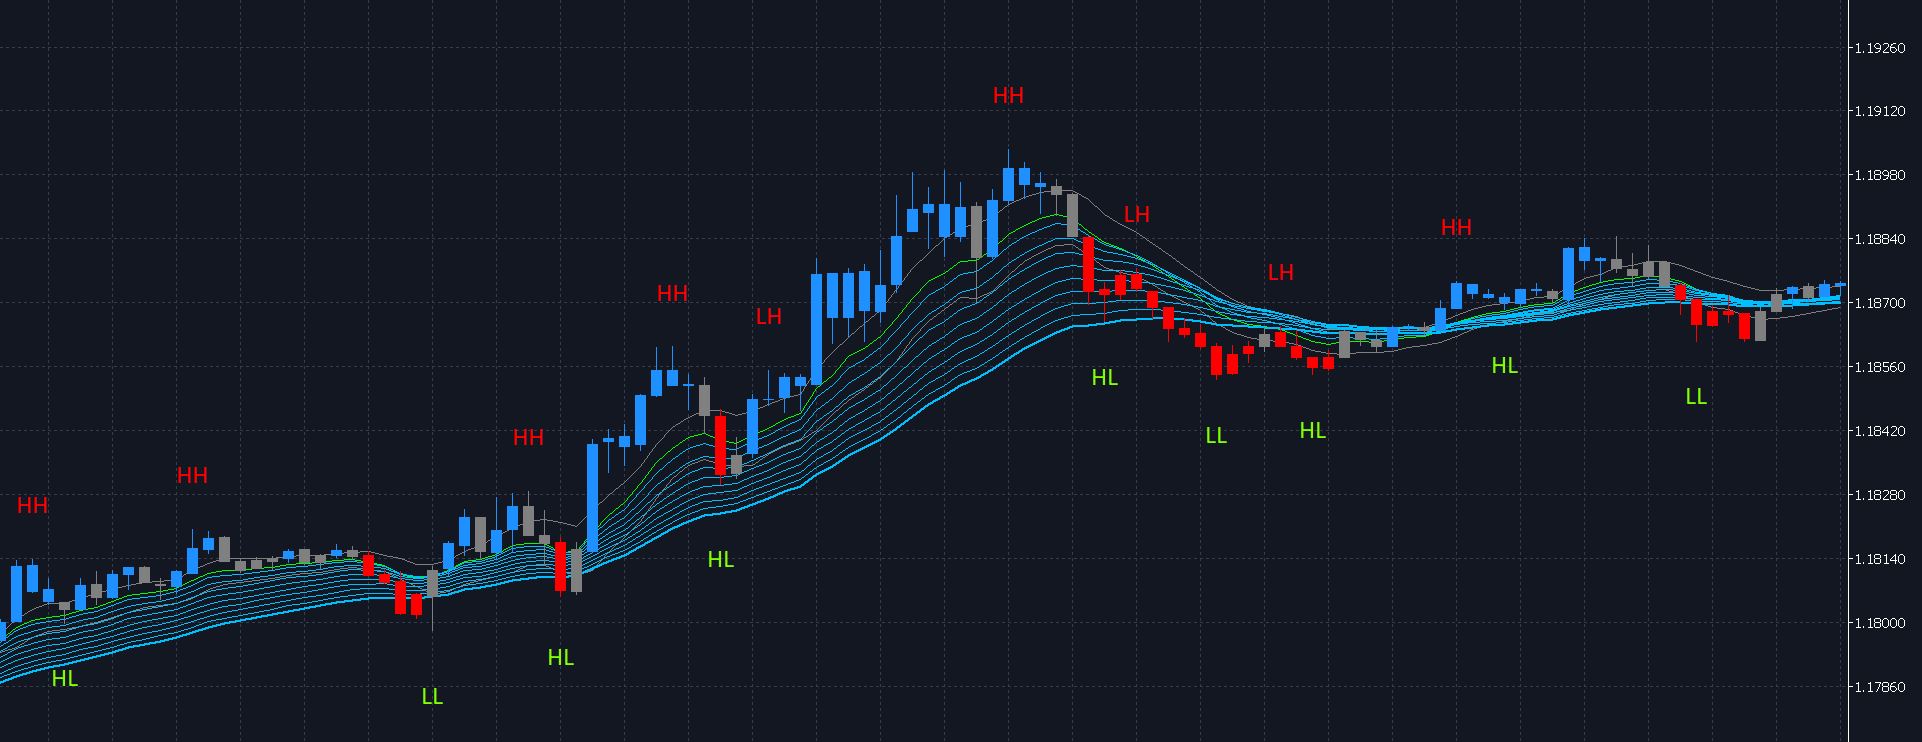
- Optional display of HH, LH, LL, HL scanner (disabled by default)
- What this does is use the same fractal locations and determine whether it's a lower low, lower high, etc.
*For more details on input configurations visit the indicator and EA pages of this setup.
Part 2: Reversal Breakout & Trend Trading
Reversal Breakout & Trend Trading (D1, 4H, 1H, M30 & M15 timeframes recommended)
     A 'W'  has 5 points, A, B, C, D and E                                E
     Point A can be any point                                        C   /
     Point B should be lower than A                             A   / \ /
     Point C should be higher than B                             \ /   D
     Point D should be lower than C, but higher than B            B
     Point E should be higher than C
     A 'M'  has 5 points, A, B, C, D and E                        B
     Point A can be any point                                    / \   D
     Point B should be higher than A                            A   \ / \
     Point C should be lower than B                                  C   \
     Point D should be higher than C, but lower than B                    E
     Point E should be lower than C
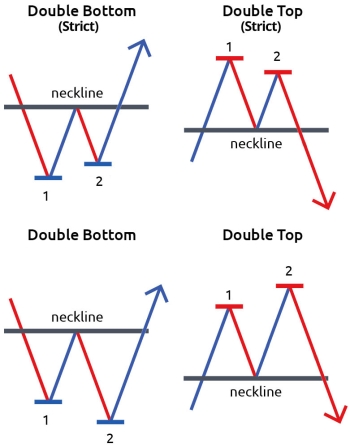
Detects double bottoms and double tops by locating A, B, C, D and E points within:
- Price Candles (close or low/high)
- Double top: Downward Trend
- Double bottom: Upward Trend
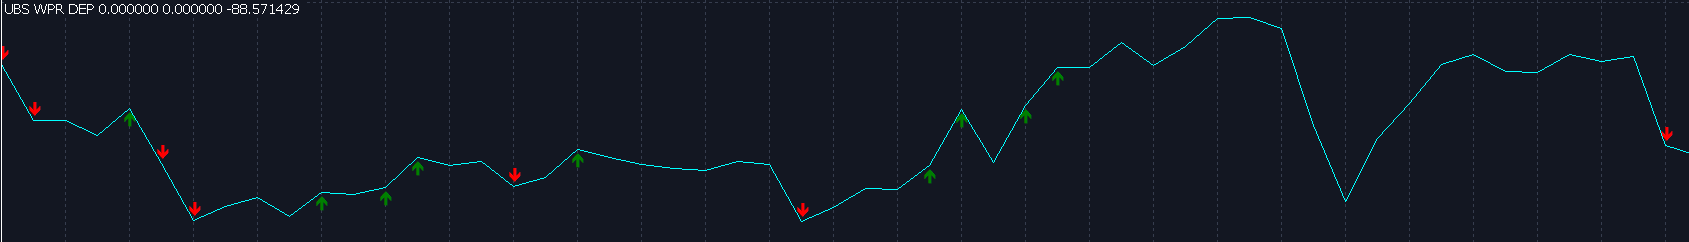
- Williams %R (WPR)
- Double top: Downward Trend
- Double bottom: Upward Trend
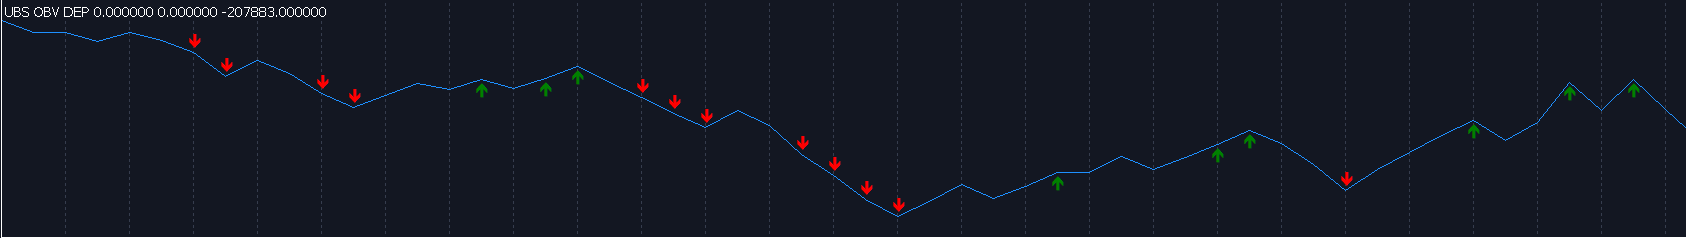
- On Balance Volume (OBV)
- Double top: Downward Trend
- Double bottom: Upward Trend
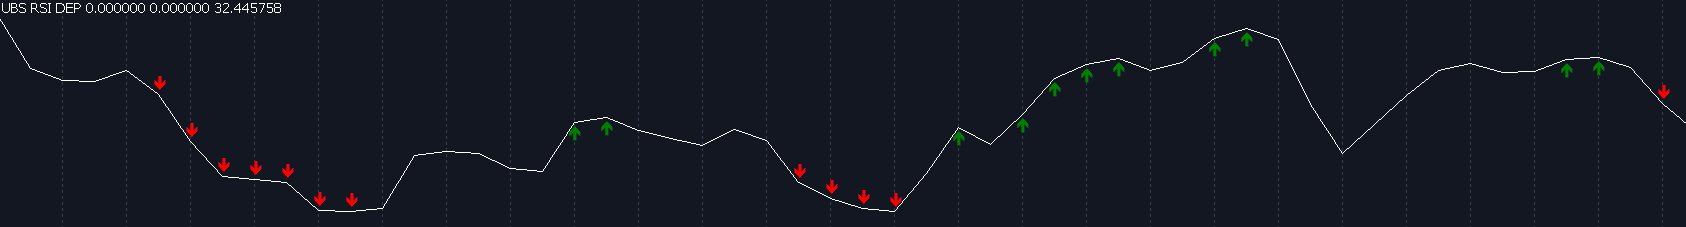
- Relative Strength Index (RSI)
- Double top: Downward Trend
- Double bottom: Upward Trend
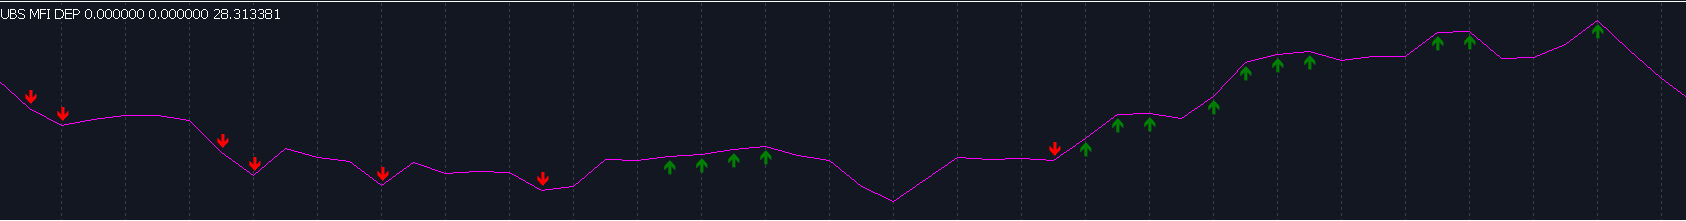
- Money Flow Index (MFI)
- Double top: Downward Trend
- Double bottom: Upward Trend
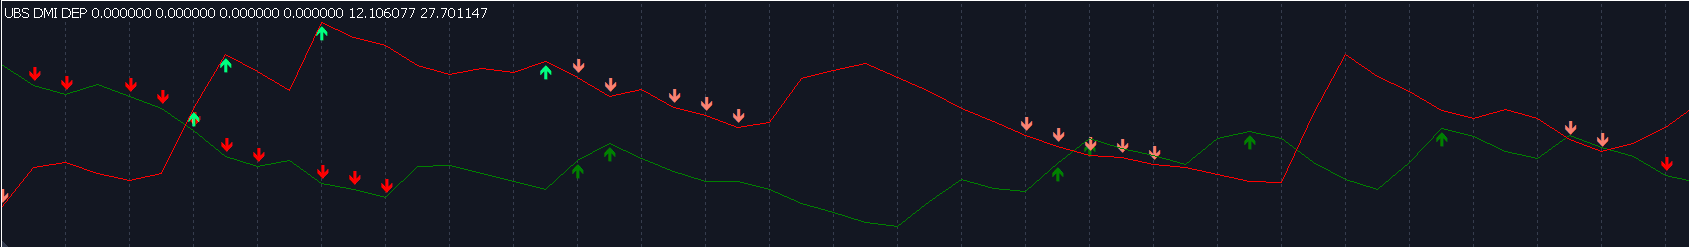
- Directional Movement Index (DMI) - DI+ and DI- only
- DI+
- Double top: Downward Trend
- Double bottom: Upward Trend
- DI-
- Double top: Upward Trend
- Double bottom: Downward Trend
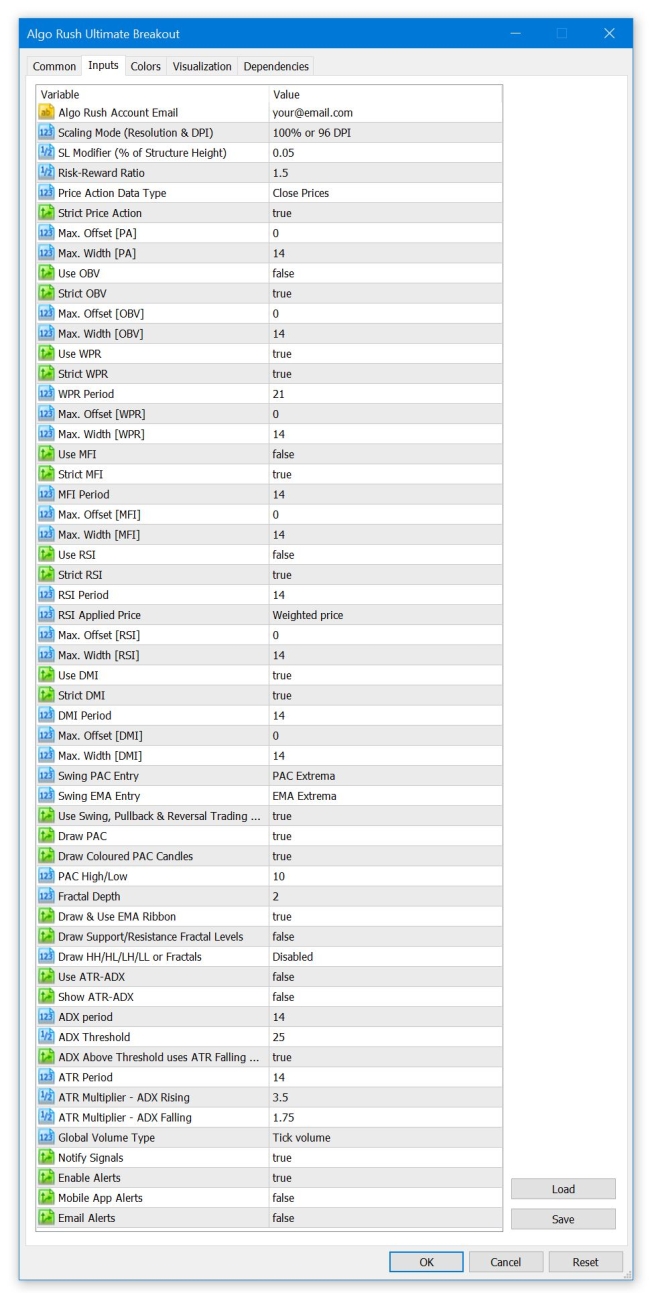
For each of these indicators you set the following options:
- Use: whether you want to use it
- The maximum width: over how many bars a W / M is allowed to form
- The maximum offset: how many bars back a W / M is allowed to form
- Length: length of the indicator, for example a 14 bar RSI
- Strict: when not set, point D no longer has to be above B (for W), and no longer has to be below B (for M). See example below of both strict and non-strict double bottom and double top.
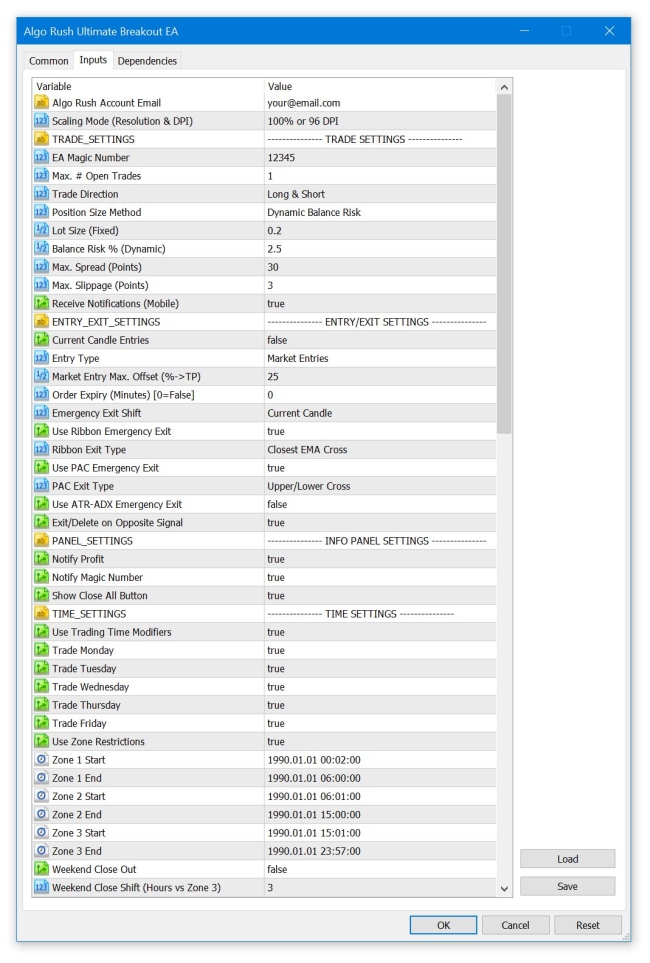
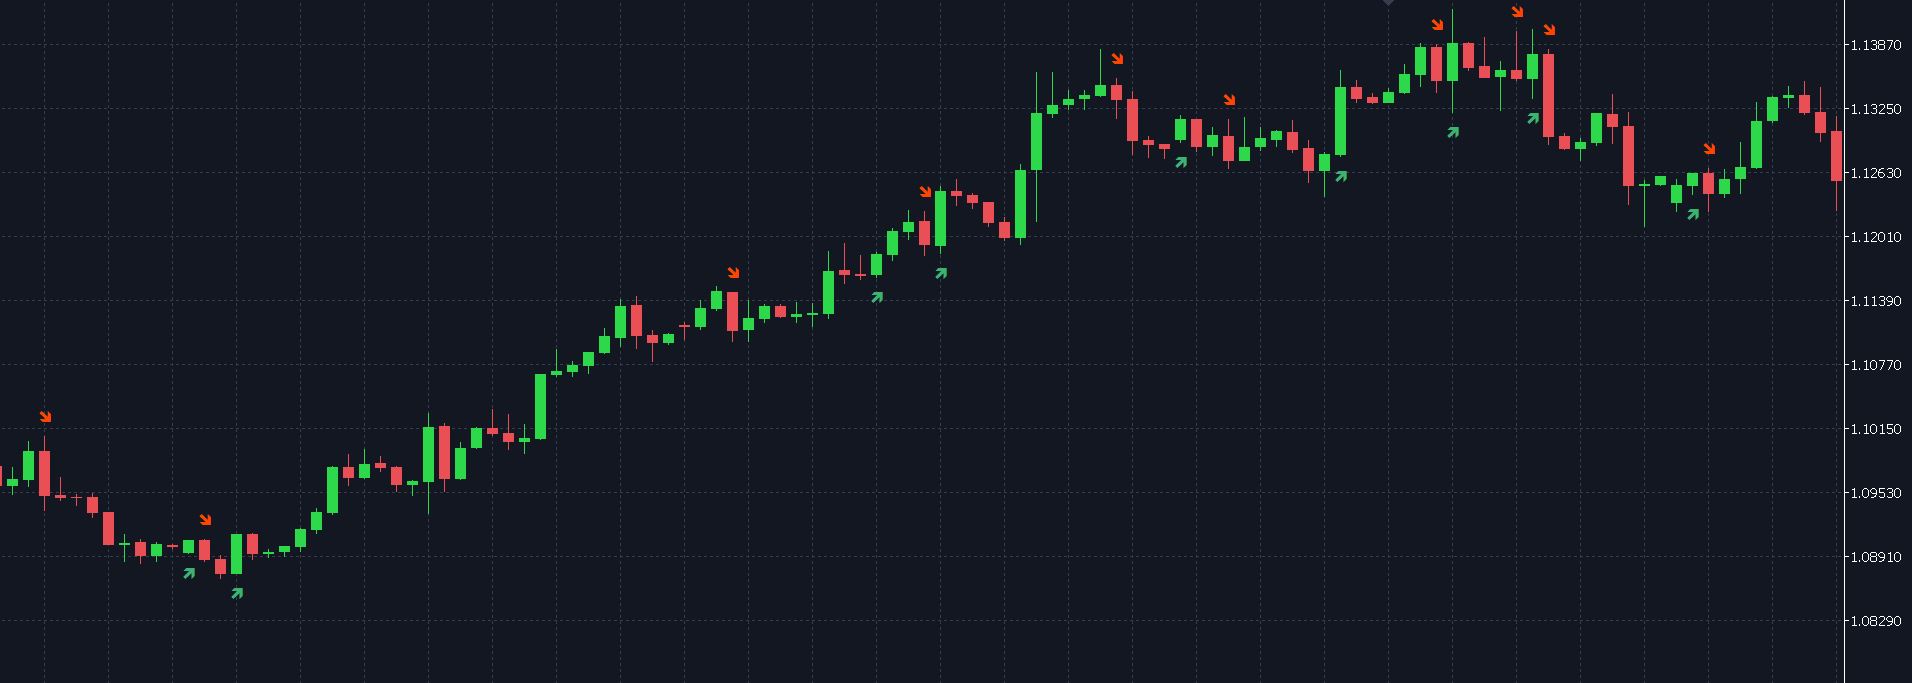
Users have the option to trade the on the W or M breakout while using swing trading tools and various trend and volatility indicators to use as entry reasons. The configurable risk-reward ratio is calculated from the high of the double top or double bottom structure with an optional stoploss offset percentage input.
*For more details on input configurations visit the indicator and EA pages of this setup.
Part 3: Trend Identification & Safety Exit Measures
Here are the following hybrid indicators that help the system determine the direction of the trend.
- Double Adaptive ATR-ADX:
- The ATR-ADX stop is effectively a double adaptive stop that trails the price, by both adapting to the true range of the price, and the average directional change. When the stop is below the price (long trade) the value never decreases until the price intersects the stop, and it reverses to being above the price (short trade). When the stop is above the price it will never increase until it is intersected by the price. As the true range and ADX change, the stop will move more quickly or more slowly.
- Constructs the trailing ATR stop above or below the price, and switches directions when the source price breaks the ATR stop. Uses the Average Directional Index (ADX) to switch between ATR multipliers.
- The higher multiplier is used when the ADX is rising, and the lower ATR multiplier is used with the ADX is falling.
- This ADX criteria further widens the gap between the source price and the trailing ATR stop when the price is trending, and lessens the gap between the ATR and the price when then price is not trending.
- First, if the 'Above Threshold' box is checked,the falling (smaller) multiplier will be used regardless once the ADX rises above a certain threshold (default > 30). The ATR will effectively rise faster once the price enters 'very trendy' mode.
- Typically, ADX > 20/25 is used in classic ADX trading. The idea behind this extra multiplier criteria is that once the price starts trending 'very' well, a top/bottom is likely near, and when that top comes the price will quickly rebound.
- Price Action Channel (PAC) Cross
- The PAC can be adjusted, by default the PAC High/Low is set to 10.
- If enabled long: the position will immediately sell once the price touches the upper limit of the channel from above.
- If enabled short: the position will immediately sell once the price touches the lower limit of the channel from below.
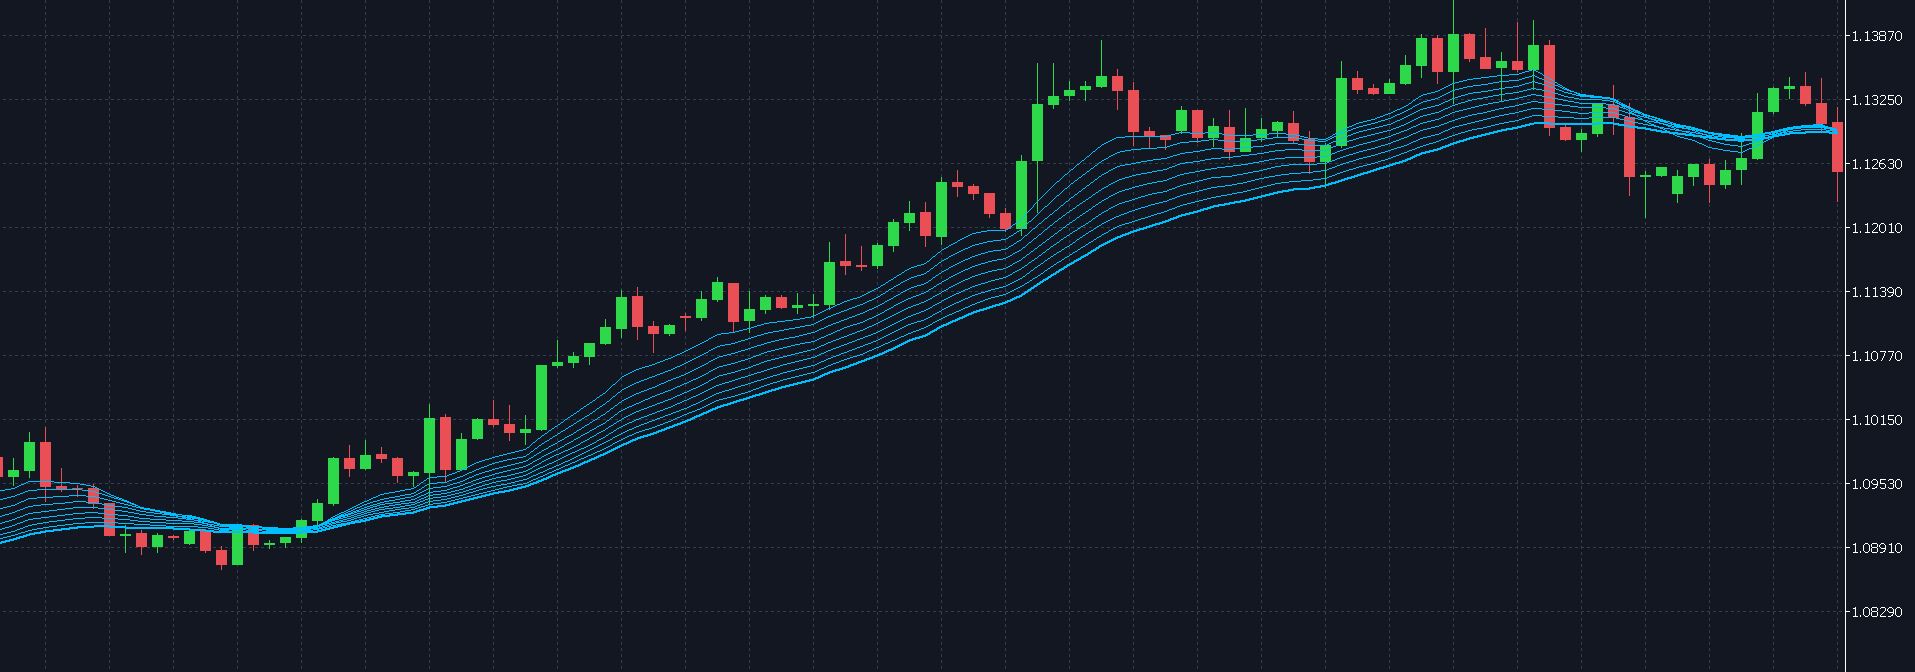
- EMA Ribbon Cross
- Uses EMA lines: 12 , 15 , 18 , 21 , 24 , 27 , 30 , 33 , 36
- If enabled long: the position will immediately sell once the price touches the upper limit of the EMA ribbon from above.
- If enabled short: the position will immediately sell once the price touches the lower limit of the EMA ribbon from below.
- Fractals:
- The fractal can be adjusted, by default the Fractal (L/R) length is set to 4.
- If enabled long: the position will immediately sell once a bearish fractal forms or closes.
- If enabled short: the position will immediately sell once a bullish fractal forms or closes.
All Trend Identifications Enabled
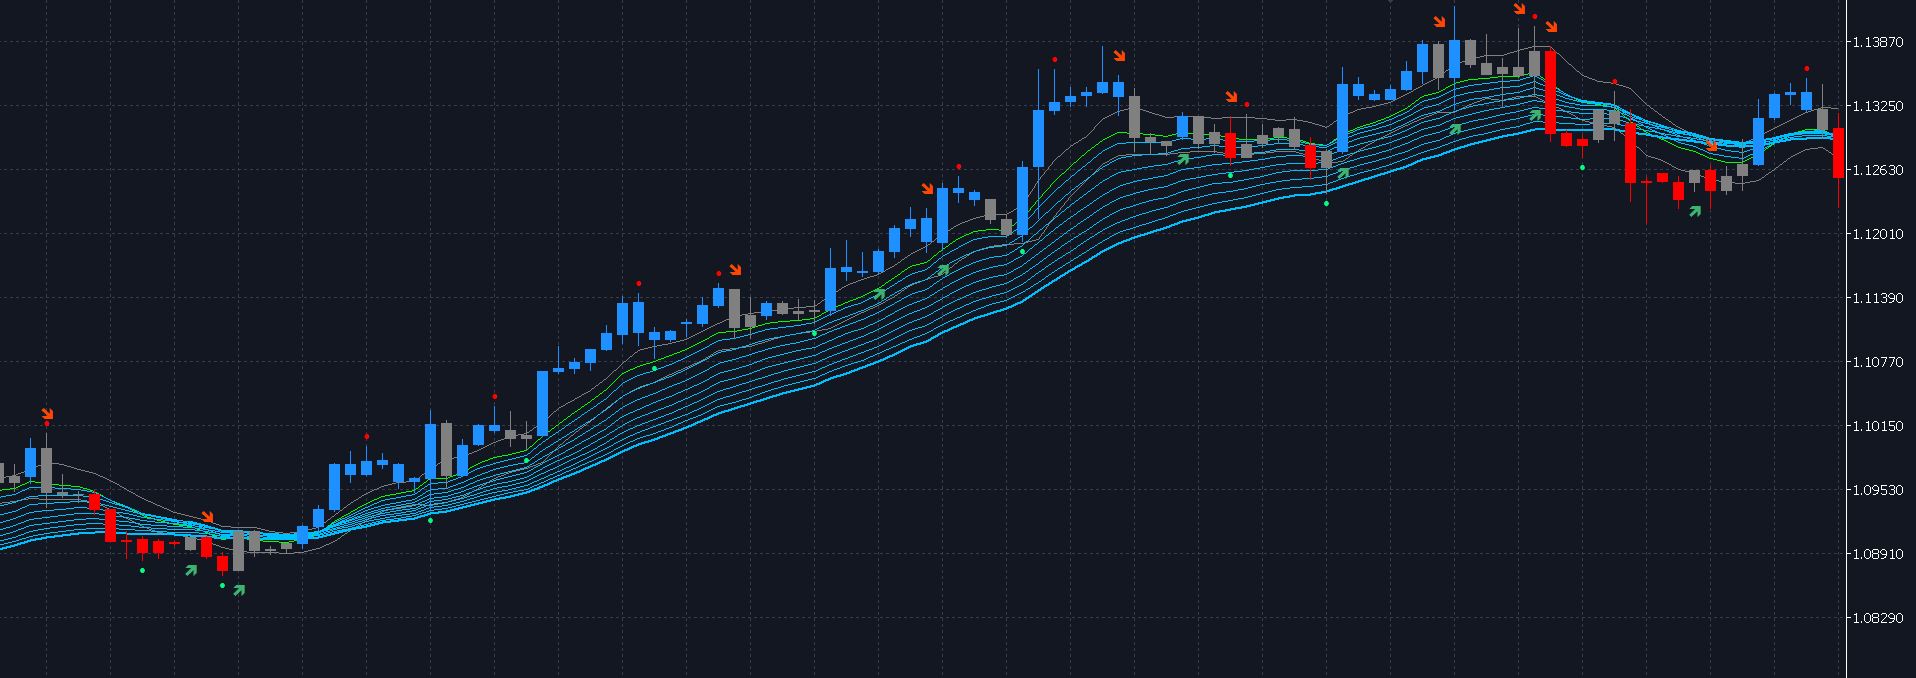
All options related to this part on the indicator and Expert Advisor versions of the Ultimate Breakout setup