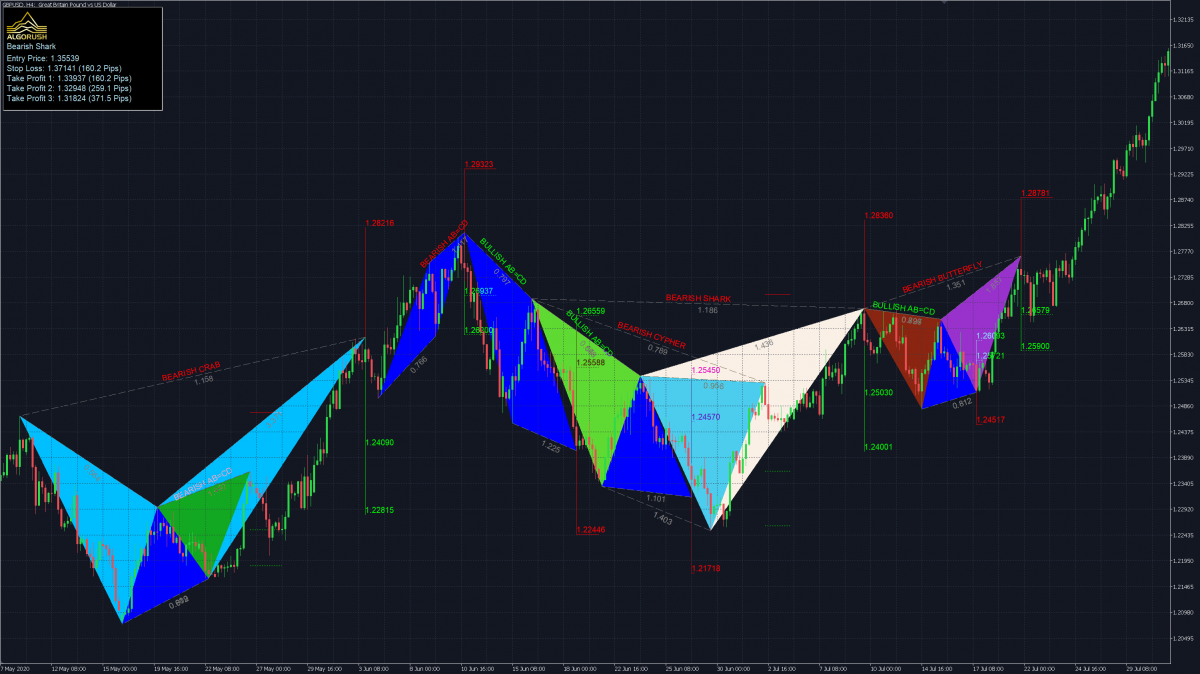
Harmonic price patterns are precise, requiring the pattern to show movements of a particular magnitude in order for the unfolding of the pattern to provide an accurate reversal point. Although a pattern may emerge that looks harmonic, if the specific Fibonacci levels do not align, the pattern will likely fail. However patient traders can use this to their advantage to trade high probability setups.
Table of Contents
Background
Whilst the word ‘Harmonic’ may instantly have you thinking about a grand orchestra, the idea of ‘Harmony’ within nature is a well established one. Physicists use harmonics to model the interference between waves, Game Theory uses harmonic situations to model human behaviour and so it should come as no surprise to also see harmonics being applied to the world of trading.
Scott Carney us credited with coining the phrase “Harmonic Trading” in the 1990’s, he is also credited as the primary influence who popularized the use of Fibonacci ratios and their respective patterns over the past twenty years. Whilst Fibonacci levels serve use in laying out general zones for traders, harmonics take them to the next level.
What are Harmonic Patterns?
The primary theory behind harmonic patterns is dependent upon timeseries relationships that can be explained using Fibonacci Ratio’s. The Fibonacci sequence of numbers, starting with zero and one, is created by adding the previous two numbers: 0, 1, 1, 2, 3, 5, 8, 13, 21, 34, etc.
At the root of the theory is the primary ratio, 0.618, or some transformation of it. The ratio is found in an astonishing amount of natural and environmental structures and events; it is also found in man-made structures. A classic example is a snail’s shell which has a spiral which can be described exactly by using the primary ratio. Since the pattern repeats throughout nature and within society, the ratio is also seen in the markets, which are affected by the environments and societies in which they trade.
The basic idea of using these ratios is to identify key turning points, retracements, and extensions along with a series of the swing high and the swing low points. The derived projections and retracements using these swing points (Highs and Lows) will give key price levels for Targets or Stops.
When properly identified, harmonic patterns allow traders to enter the trade in a high probability reversal zone with minimal risk.
Types of Harmonic Patterns
Generally, all harmonic patterns are based on 4/5 turning points in price.
Each type of harmonic pattern has a different geometrical shape and Fibonacci ratio accompanying it. We name these points X (if 5 points used), A, B, C and D. Each harmonic pattern follows its own set of rules that will discuss in greater detail later in the article.
Bullish ABCD Pattern
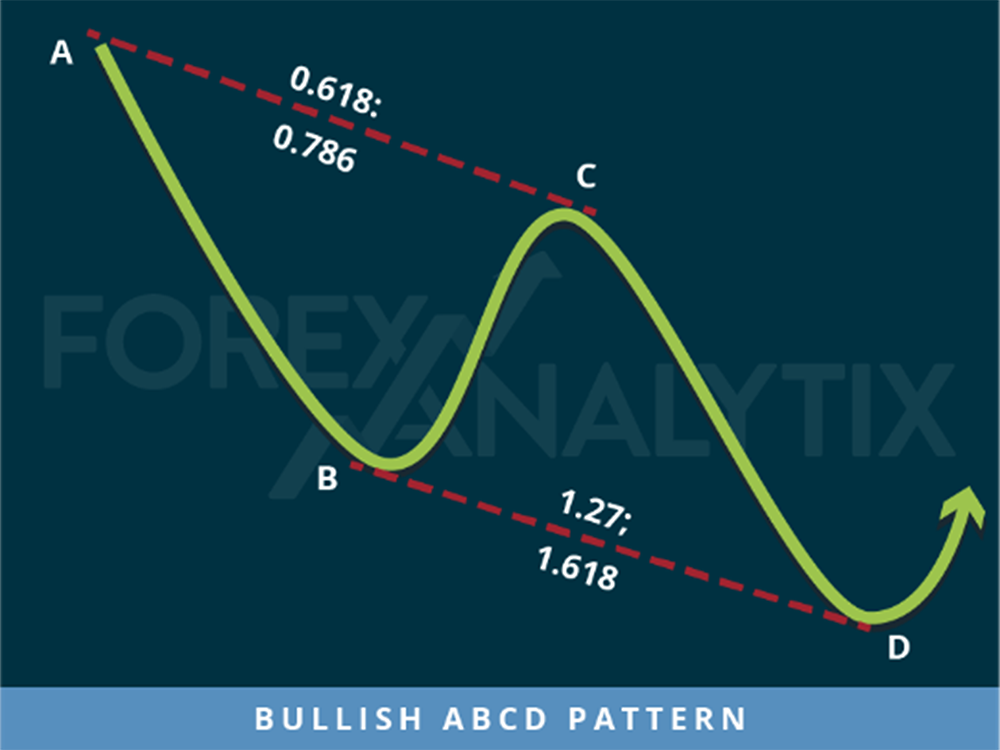
A trend continuation pattern that was discovered by Gartley in 1935. The lines AB and CD are known as the legs while BC is called the correction or retracement. In an ideal ABCD pattern the two legs (sections) which are equal in distance and time. The correction should ideally retrace to either a 0.618 or 0.786 which sets up a point D that is either a 1.27 or 1.618 of the BC correction. A 0.618 retracement at the C point results in a 1.618 BC projection. A 0.786 retracement at the C point results in a 1.27 projection to point D.
The first target would be the 0.382 retracement of AD and the second target the 0.618 retracement of AD. A common stop level is behind a structure level beyond the D point. Conservative traders may look for additional confirmation before entering a trade, for instance an aligning RSI value or a Parabolic SAR change.
Bullish Alternate ABCD Pattern
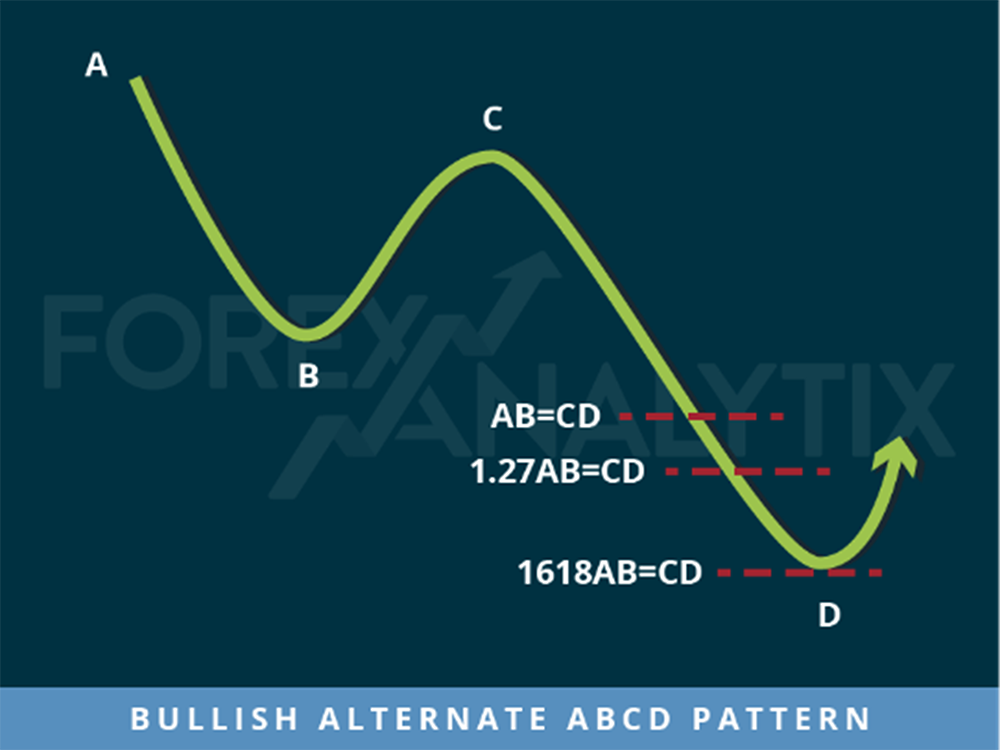
This is a variation of the standard ABCD pattern and is also core to all harmonic patterns. It provides for a CD leg that is not equal to the AB leg but still has a Fibonacci relationship to the AB leg and the BC correction. Its best use is in validating other patterns, for example the best Gartley patterns have an AB=CD structure but Bat or Crab patterns utilize alternate ABCD patterns. We would rarely trade an alternate ABCD pattern on its own unless it lined up with another Fibonacci structure.
Bearish ABCD Pattern
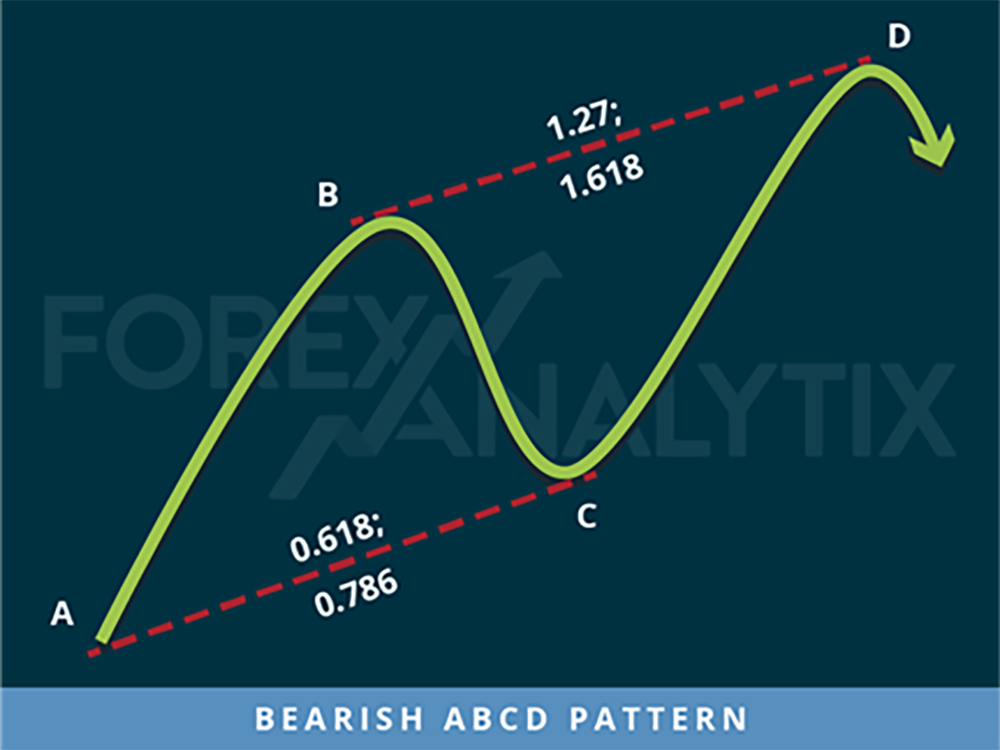
Another trend continuation pattern that was discovered by Gartley in 1935, this can be seen as the inverse of the bullish pattern. The lines AB and CD are known as the legs while BC is called the correction or retracement. In an ideal ABCD pattern the two legs are equal in distance and time. The correction should ideally retrace to either a 0.618 or 0.786 which sets up a point D that is either a 1.27 or 1.618 of the BC correction. A 0.618 retracement at the C point results in a 1.618 BC projection. A 0.786 retracement at the C point results in a 1.27 projection to point D.
Bearish Alternate ABCD Pattern
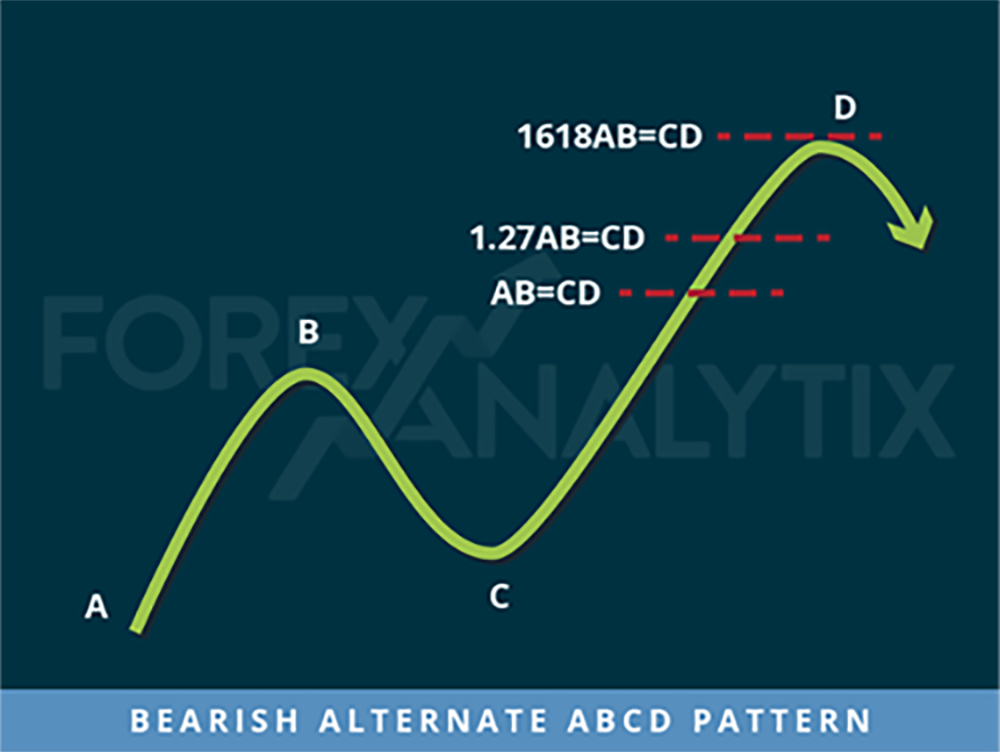
This is a variation of the standard ABCD pattern and is also core to all harmonic patterns, it can again be seen as the inverse of the bullish alternate ABCD pattern. It provides for a CD leg that is not equal to the AB leg but still has a Fibonacci relationship to the AB leg and the BC correction. Its best use is again in validating other patterns, for example the best Gartley patterns have an AB=CD structure but Bat or Crab patterns utilize alternate ABCD patterns. We would rarely trade an alternate ABCD pattern on its own unless it lined up with another Fibonacci structure.
Considerations when using Harmonics
Harmonic price patterns are precise, requiring the pattern to show movements of a particular magnitude in order for the unfolding of the pattern to provide an accurate reversal point. Although a pattern may emerge that looks harmonic, if the specific Fibonacci levels do not align, the pattern will likely fail. However patient traders can use this to their advantage to trade high probability setups.
As with all trading strategies, Harmonics are not completely infallible. Harmonic patterns can gauge how long current moves will last, but they can also be used to isolate reversal points. The danger occurs when a trader takes a position in the reversal area and the pattern fails. When this happens, the trader can be caught in a trade where the trend rapidly extends against him. Therefore, risk management is paramount to any successful trader.
Harmonic trading is a precise and mathematical way to trade and as with all math it requires patience, practice, and a lot of studies to master the patterns.
Visit the following links (opens in new window) to try the ABCD and Alternate ABCD patterns with the Algo Rush Harmonic Patterns System:
