Table of Contents
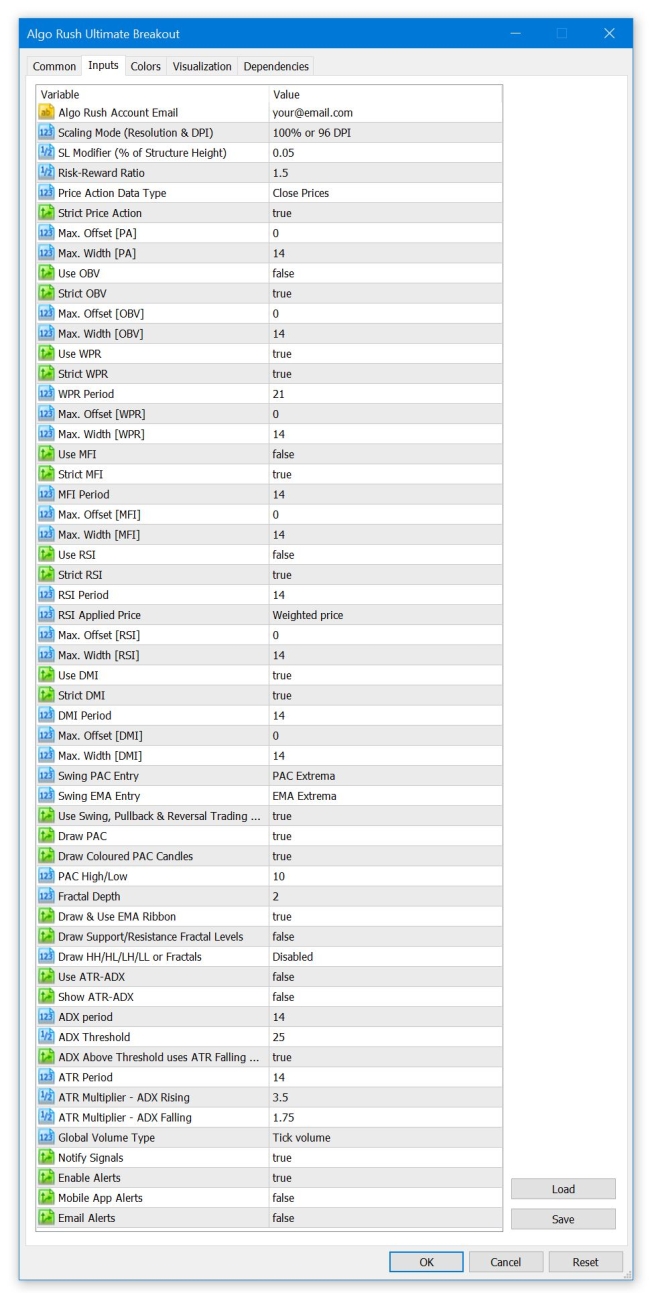
Ultimate Breakout Indicator Configuration
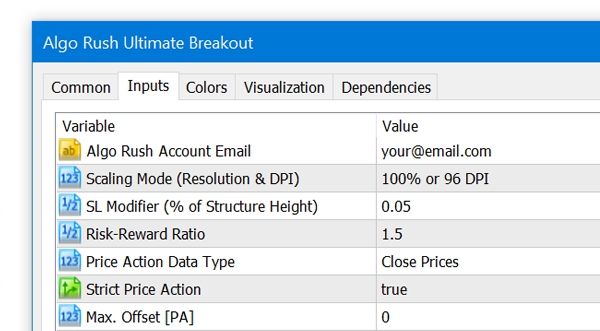
Algo Rush Account Email
The email address that the active Algo Rush subscription is under.
- Note: The indicators and Expert Advisors will not initiate without an email address linked to an active subscription.
Scaling Mode (Resolution & DPI)
Users with resolutions above 1080p (1920×1080) or display scaling values set above 96 DPI will need to adjust the scaling mode settings to an option above the default 100% value. Adjusting this will resolve any issues with displaying objects such as text, buttons and windows within active charts.
- 100% or 96 DPI (default)
- 125% or 120 DPI
- 150% or 144 DPI
- 175% or 168 DPI
- 200% or 192 DPI
- 225% or 216 DPI
- 250% or 240 DPI
SL Modifier (% of Structure Height)
The option to set an additional percentage offset away from the entry level and the calculated low of the double bottom or high of the double top structure.
- 0.05 (5%) (Default)
Risk-Reward Ratio
The risk reward ratio is calculated by multiplying the distance between the anticipated entry level and the low of the double bottom (or high of the double top) to determine take profit levels. A risk-reward of 2-1 (default option) indicates that the distance of the take-profit from the desired entry level is twice the distance as the distance of the stop-loss from the desired entry level.
- Default: 2
Price Action Data Type
- Close Prices (default)
- The close price will be used to calculate double bottoms and double tops for both directions.
- High Low Prices
- For longs, the low price will be used to calculate double bottoms within price data
- For shorts, the high price will be used to calculate double tops within price data
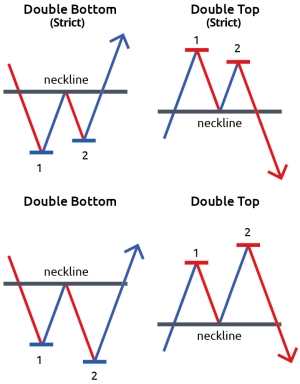
Strict Price Action
Defines if the double bottom or double top needs to have have a proper structure. By definition, proper structure for double bottoms include the right side being higher than the left side and for double tops the right side must be lower than the left side. If disabled, all double top and bottom structures will be accounted for within Price close or high/low data (depends on the option chosen above) regardless if proper or not. See image below:
- Default: true
Max. Offset [PA]
How many bars back a double bottom or double top structure is allowed to be formed within price data for the upcoming signal.
- Default: 0
Max. Width [PA]
Over how many bars a double bottom or double top structure is allowed to form a signal on price data.
- Default: 14
Use OBV
- True
- False (default)
Strict OBV
Defines if the double bottom or double top needs to have have a proper structure. By definition, proper structure for double bottoms include the right side being higher than the left side and for double tops the right side must be lower than the left side. If disabled, all double top and bottom structures will be accounted for within On-Balance (Tick) Volume data regardless if proper or not. See image below:
- Default: true
Max. Offset [OBV]
How many bars back a double bottom or double top structure is allowed to be formed within On-Balance (Tick) Volume data for the upcoming signal. Keep in mind that MOST pairs on MetaTrader offer tick volume rather than pure volume.
- Default: 0
Max. Width [OBV]
Over how many bars a double bottom or double top structure is allowed to form a signal on On-Balance (Tick) Volume data. Keep in mind that MOST pairs on MetaTrader offer tick volume rather than pure volume.
- Default: 14
Use WPR
- True (default)
- False
Strict WPR
Defines if the double bottom or double top needs to have have a proper structure. By definition, proper structure for double bottoms include the right side being higher than the left side and for double tops the right side must be lower than the left side. If disabled, all double top and bottom structures will be accounted for within Williams's %R data regardless if proper or not. See image below:
- Default: true
WPR Period
- Default: 21
Max. Offset [WPR]
How many bars back a double bottom or double top structure is allowed to be formed within Williams %R data for the upcoming signal.
- Default: 0
Max. Width [WPR]
Over how many bars a double bottom or double top structure is allowed to form a signal on Williams %R data.
- Default: 14
Use MFI
- True
- False (default)
Strict MFI
Defines if the double bottom or double top needs to have have a proper structure. By definition, proper structure for double bottoms include the right side being higher than the left side and for double tops the right side must be lower than the left side. If disabled, all double top and bottom structures will be accounted for within Money Flow Index data regardless if proper or not. See image below:
- Default: true
MFI Period
- Default: 14
Max. Offset [MFI]
How many bars back a double bottom or double top structure is allowed to be formed within Money Flow Index data for the upcoming signal.
- Default: 0
Max. Width [MFI]
Over how many bars a double bottom or double top structure is allowed to form a signal on Money Flow Index data.
- Default: 14
Use RSI
- True
- False (default)
Strict RSI
Defines if the double bottom or double top needs to have have a proper structure. By definition, proper structure for double bottoms include the right side being higher than the left side and for double tops the right side must be lower than the left side. If disabled, all double top and bottom structures will be accounted for within Relative Strength Index applied price data (chosen below) regardless if proper or not. See image below:
- Default: true
RSI Period
- Default: 14
RSI Applied Price
- Close price
- Open price
- High price
- Low price
- Median price
- Typical price
- Weighted price (default)
Max. Offset [RSI]
How many bars back a double bottom or double top structure is allowed to be formed within Relative Strength Index data for the upcoming signal.
- Default: 0
Max. Width [RSI]
Over how many bars a double bottom or double top structure is allowed to form a signal on Relative Strength Index data.
- Default: 14
Use DMI
- True (default)
- False
Strict DMI
Defines if the double bottom or double top needs to have have a proper structure. By definition, proper structure for double bottoms include the right side being higher than the left side and for double tops the right side must be lower than the left side. If disabled, all double top and bottom structures will be accounted for within Directional Movement Index data regardless if proper or not. See image below:
- Default: true
DMI Period
- Default: 14
Max. Offset [DMI]
How many bars back a double bottom or double top structure is allowed to be formed within Directional Movement Index data for the upcoming signal.
- Default: 0
Max. Width [DMI]
Over how many bars a double bottom or double top structure is allowed to form a signal on Directional Movement Index data.
- Default: 14
Swing PAC Entry
Prerequisite entry condition requiring that the price respects the following Price Action Channel limits:
- PAC Extrema (Default)
- PAC Mid (Close)
- PAC Opposite
- Disabled
Swing EMA Entry
Prerequisite entry condition requiring that the price respects the following EMA ribbon limits:
- EMA Extrema (Default)
- EMA Mid (Close)
- EMA Opposite
- Disabled
Use Swing, Pullback & Reversal Trading System
Enables the usage of PAC and EMA Ribbons as prerequisites for entry conditions.
- Default: true
Draw PAC
- Default: true
Draw Coloured PAC Candles
- Default: true
PAC High/Low
- Default: 10
Fractal Depth
How many candles left and right should be used to calculate. Example: if 2 is selected, from the middle candle it will scan 2 candles left and 2 candles right for a total of 5 candles. The default 2 is a classic 5-bar fractal, see image below.
- 1
- 2 (default)
- 3
- 4
- 5
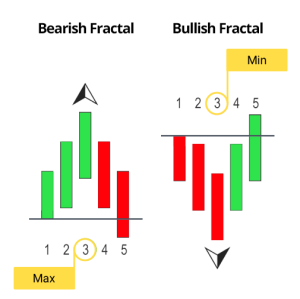
Above is a classic 5 bar bullish and bearish fractal (scans 2 to the left and 2 to the right). When the default option 2 is used, the extension for the trend fib will be plotted on the close of the far right fractal within the 5 bar structure.
Draw & Use EMA Ribbons
- Default: true
Draw Support/Resistance Fractal Levels
Draws lines that represent support and resistance based off the value inputted for the “Fractal Depth” option.
- Default: true
Draw HH/HL/LH/LL or Fractals
- Disabled (Default)
- HH/HL/LH/LL
- Fractals
- Both
Use ATR-ADX
Enables the usage of Double Adaptive ATR-ADX as prerequisites for entry conditions.
- Default: true
Show ATR-ADX
Enables the overlay display of the Double Adaptive ATR-ADX trend direction arrows.
- Default: true
ADX Period
- Default: 14
ADX Threshold
- Default: 25
ADX Above Threshold uses ATR Falling Multiplier Even if Rising?
- Default: true
ATR Period
- Default: 14
ATR Multiplier - ADX Rising
- Default: 3.5
ATR Multiplier - ADX Falling
- Default: 1.75
Global Volume Type
- Tick volume (default)
- Real volume
Info Panel Pixel Shift
- Default: 0
- For resolutions higher than 1080p such as 2k, 4k, etc: 5-20.
Notify Signals
- Default: true
Enable Alerts
- Default: true
Mobile Alerts
- Default: false
Mail Alerts
- Default: false