Table of Contents
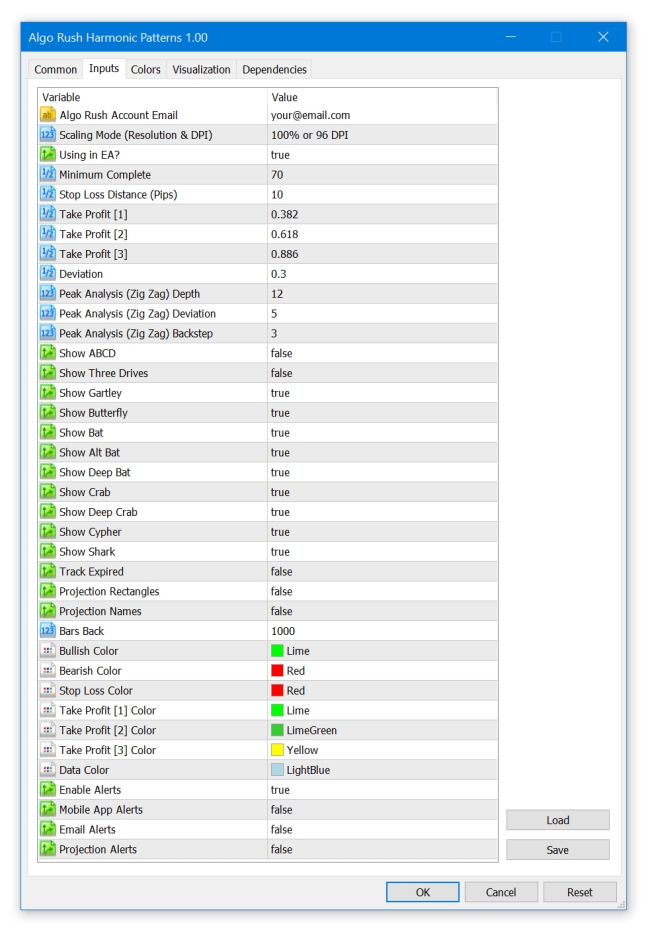
Harmonic Patterns Indicator Configuration
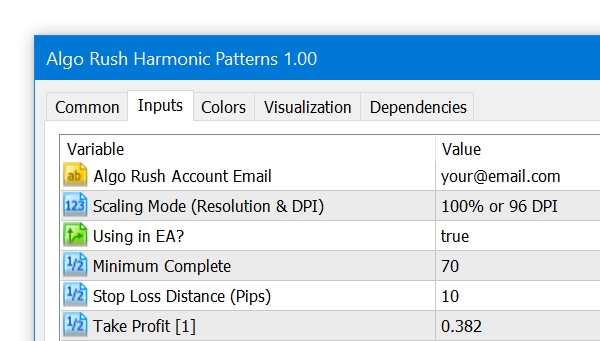
Algo Rush Account Email
The email address that the active Algo Rush subscription is under.
- Note: The indicators and Expert Advisors will not initiate without an email address linked to an active subscription.
Scaling Mode (Resolution & DPI)
Users with either resolutions above 1080p (1920×1080) or DPIs above 96 will need to adjust the scaling mode settings to an option above the default 100% value. Adjusting this will resolve any issues with displaying objects such as text, buttons and windows within active charts.
- 100% or 96 DPI (default)
- 125% or 120 DPI
- 150% or 144 DPI
- 175% or 168 DPI
- 200% or 192 DPI
- 225% or 216 DPI
- 250% or 240 DPI
Using in EA?
When you are using the indicator inside an EA you should set it true to prevent drawing visual objects so the EA will save data of detected harmonic pattern in a separate text file for further use.
- Default: false
Min. Complete
A form of deviation but only for projection patterns. When you set 'Deviation' paramater too strict the scanner will check the MinComplete parameter. How much you decrease will form more projections as a result.
- Default: 70
SL Distance (Pips)
You can increase SL level by increasing this value, it's simply just additional pips to stop loss fib level.
- Default: 10
TP [1]
The first multiplier within the fib range for determining second take profit level.
- Default: 0.382
TP [2]
The second multiplier within the fib range for determining second take profit level.
- Default: 0.618
TP [3]
The third multiplier within the fib range for determining second take profit level.
- Default: 0.886
Deviation
A number to determine the percentage of how much away a pattern can deviate from its original harmonic pattern structure. How much you increase it will increase the number of detected patterns that have a higher deviation from the original patterns' ratio. Keeping it low will give you less patterns with the trade-off for getting cleaner and more appropriate pattern matches.
- Default: 0.3
Peak Analysis Depth
- Default: 12
A minimum amount of periods needed for the trend to be able to change/switch. With a depth of 1, the trend can change every period (bar) however with a depth of 2 the trend can change only starting from 2 periods (bars). The value you use ultimately depends on what the length of your chosen period is. Below is an example:
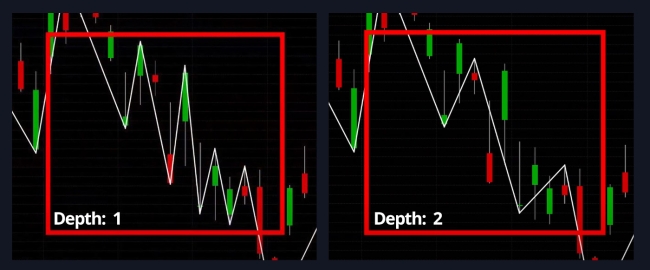
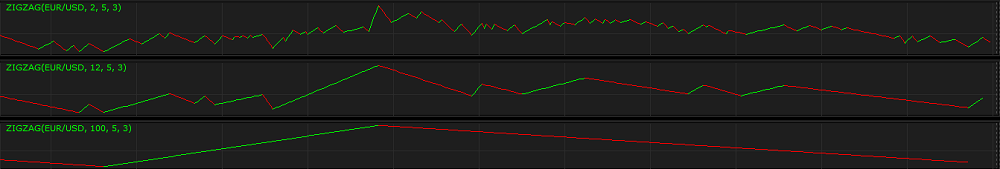
Depth - the parameter allows to specify the minimum number of periods, needed to draw one segment of the indicator's line. The possible values are from 1 through 10,000. The default value is 12. The smaller the number is, the shorter the segments are and the line changes its direction more often. The greater the number is, the longer the segments are, and the line changes its direction less frequently. A trader chooses the Depth parameter's value in accordance with what chart figures need to be identified. For identifying Harmonic Patterns and Elliott Waves, for example, the commonly used value is the default one - 12.
Below you can see examples of ZIGZAG indicators with different Depth parameter's values (2, 12, 100) drawn in additional areas.
Peak Analysis Deviation
- Default: 5
The minimum percentage that price has to change in order for the trend to change directions. The default value is 5. A trader chooses the Backstep parameter's value in accordance with what chart figures need to be identified.
- Will look for the previous low, then look for the uptrend.
- For shorts it will look for the previous high, then look for the downtrend.
In the example below, we included a variety of different zigzag lines with different deviation values. These differences in deviation values determine how strong a rebound has to be (in terms of % change) for a pivot to be considered. This works in conjunction with the “Depth” option since that option defines the minimum amount of periods (bars) required since the last rebound if the deviation rule becomes valid at any time.
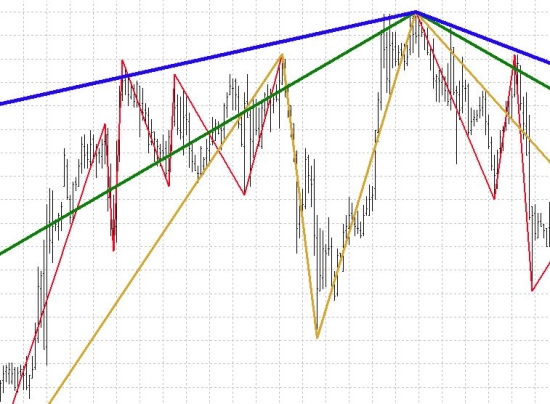
- Blue line: 5% deviation (highest deviation value, least elastic to changes)
- Green line: 3% deviation
- Yellow line: 1.5% deviation
- Red line: 1% deviation (lowest deviation value, most elastic to changes)
Peak Analysis Backstep
- Default: 3
Backstep reflects the minimum amount of bars between which the high and low can be plotted, you can think of this of the total width of the potential fib retracement/extension based off candlestick width periods. These settings should be adapted to various financial markets and you will probably end up using different settings for one market, instrument, price/harmonic pattern, and so fourth. Additionally, you could also end up changing the settings for the same market or indicator when the market conditions change along with its volatility.
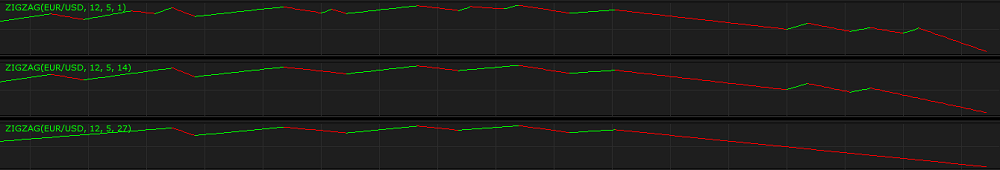
Backstep - the parameter allows to specify the number of bars backwards from the current bar to be used for an assessment triggered by reaching or surpassing the Deviation parameter's value. The possible values are from 1 through 10,000. The default value is 3. The smaller the number is, the shorter the segments are and the line changes its direction more often. The greater the number is, the longer the segments are, and the line changes its direction less frequently. A trader chooses the Backstep parameter's value in accordance with what chart figures need to be identified. For identifying Elliott Waves, for example, the commonly used value is the default one - 3.
Below you can see examples of ZIGZAG indicators with different Backstep parameter's values (1, 14, 27) drawn in additional areas.
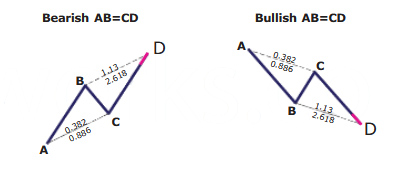
Show ABCD
- Default: false
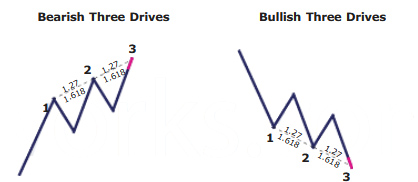
Show 3 Drives
- Default: false
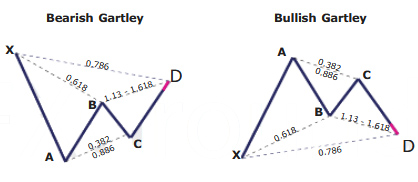
Show Gartley
- Default: true
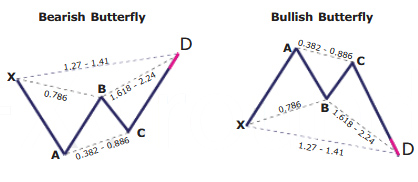
Show Butterfly
- Default: true
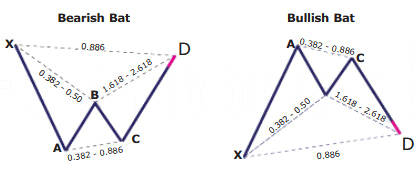
Show Bat
- Default: true
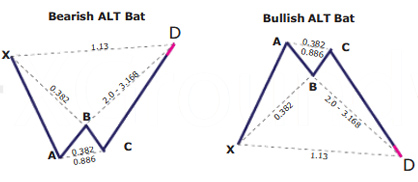
Show Alternate Bat
- Default: true
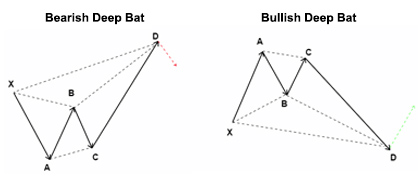
Show Deep Bat
- Default: true
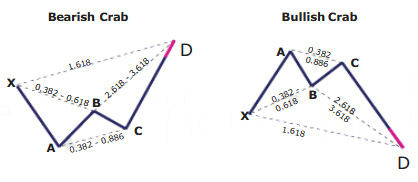
Show Crab
- Default: true
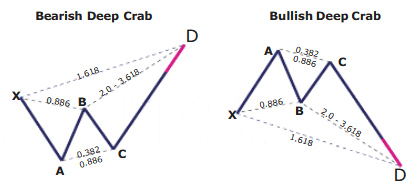
Show Deep Crab
- Default: true
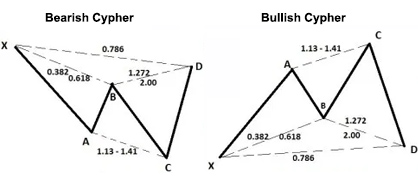
Show Cypher
- Default: true
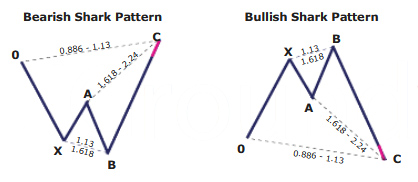
Show Shark
- Default: true
Bars Back
The amount of bars to scan back from the current bar, try to keep this to a minimum to avoid over consumption of client resources.
- Default: 5000
Bullish Color
- Default color: Lime
Bearish Color
- Default color: Red
SL Color
- Default color: Red
TP[1] Color
- Default color: DarkGreen
TP[2] Color
- Default color: Green
TP[3] Color
- Default color: Lime
Data Color
- Default color: Light Blue
Info Panel Pixel Shift
- Default: 0
- For resolutions higher than 1080p such as 2k, 4k, etc: 5-20.
Enable Alerts
- Default: true
Mobile Alerts
- Default: false
Mail Alerts
- Default: false
Projection Alerts
- Default: false